Introduction
As a picture is worth a thousand words, we may want to visualise the Exadata cells metrics. What if you could do it the way you want? build your own graph? Let’s try to achieve this with 3 layers:
- telegraf: to collect the Exadata metrics
- InfluxDB: to store the time-series Exadata metrics
- grafana: to visualise the Exadata metrics
You should first read this post: Graphing Oracle performance metrics with Telegraf, InfluxDB and Grafana prior to this one. The reason is that the current post relies on it (as the current post gives less explanation about Installation, setup and so on).
Installation
- The Installation of those 3 layers is the same as described into this blog post.
- Telegraf has been installed on one database node.
- The dcli utility has also been copied on this database node.
Setup
The setup is the same as described into this blog post except for the script being used to collect the metrics:
- The script collects the cells metrics from one database node and prints the output as InfluxDB line-protocol.
- The script assumes passwordless ssh setup to connect from the database node to the cells.
- It collects all metriccurrent metrics that are not cumulative: the dcli command being used is:
$> dcli -g ./cells_group cellcli -e "list metriccurrent attributes name,metricObjectName,metricValue,metricType where metricType !='cumulative'"
The perl script code is:
$> cat influxdb_exadata_metrics.pl
#!/usr/bin/env perl
#
# Author: Bertrand Drouvot
# influxdb_exadata_metrics.pl : V1.0 (2016/05)
#
# Utility used to extract exadata metrics in InfluxDB line protocol
#
#----------------------------------------------------------------#

BEGIN {
die "ORACLE_HOME not setn" unless $ENV{ORACLE_HOME};
unless ($ENV{OrAcLePeRl}) {
$ENV{OrAcLePeRl} = "$ENV{ORACLE_HOME}/perl";
$ENV{PERL5LIB} = "$ENV{PERL5LIB}:$ENV{OrAcLePeRl}/lib:$ENV{OrAcLePeRl}/lib/site_perl";
$ENV{LD_LIBRARY_PATH} = "$ENV{LD_LIBRARY_PATH}:$ENV{ORACLE_HOME}/lib32:$ENV{ORACLE_HOME}/lib";
exec "$ENV{OrAcLePeRl}/bin/perl", $0, @ARGV;
}
}

use strict;
use Time::Local;

#
# Variables
#
my $nbmatch=-1;
my $help=0;
my $goodparam=0;

my $dclicomm='';
my $groupcell_pattern='';
my $metrictype_pattern='ALL';
my $result;

# Parameter parsing

foreach my $para (@ARGV) {

if ( $para =~ m/^help.*/i ) {
$nbmatch++;
$help=1;
}

if ( $para =~ m/^groupfile=(.*)$/i ) {
$nbmatch++;
$groupcell_pattern=$1;
$goodparam++;
}
}

# Check if groupfile is empty

if ((!$goodparam) | $goodparam > 1) {
print "n Error while processing parameters : GROUPFILE parameter is mandatory! nn" unless ($help);
$help=1;
}

# Print usage if a difference exists between parameters checked
#
if ($nbmatch != $#ARGV | $help) {
print "n Error while processing parameters nn" unless ($help);
print " nUsage: $0 [groupfile=] nn";

printf (" %-25s %-60s %-10s n",'Parameter','Comment','Default');
printf (" %-25s %-60s %-10s n",'---------','-------','-------');
printf (" %-25s %-60s %-10s n",'GROUPFILE=','file containing list of cells','');
print ("n");
print ("utility assumes passwordless SSH from this node to the cell nodesn");
print ("utility assumes ORACLE_HOME has been set n");
print ("n");
print ("Example : $0 groupfile=./cell_groupn");
print "nn";
exit 0;
}

# dcli command

$dclicomm="dcli -g ".$groupcell_pattern. " cellcli -e "list metriccurrent attributes name,metricObjectName,metricValue,metricType where metricType !='cumulative'"";

# Launch the dcli command
my $result=`$dclicomm` ;

if ( $? != 0 )
{
print "n";
print "n";
die "Something went wrong executing [$dclicomm]n";
}

# Split the string into array
my @array_result = split(/n/, $result);

foreach my $line ( @array_result ) {
# drop tab
$line =~ s/t+/ /g;
# drop blanks
$line =~ s/s+/ /g;

#Split each line on 6 pieces based on blanks
my @tab1 = split (/ +/,$line,6);

# Supress : from the cell name
$tab1[0] =~ s/://;

# Supress , from the value
$tab1[3] =~ s/,//g;

# Add "N/A" if no Unit
if ($tab1[5] eq "") {$tab1[5]="N/A"};

# Print
print "exadata_cell_metrics,cell=$tab1[0],metric_name=$tab1[1],metricObjectName=$tab1[2],metric_type=$tab1[5],metric_unit=$tab1[4] metric_value=$tab1[3]n";
}
The output looks like (the output format is the InfluxDB line-protocol):
$> perl ./influxdb_exadata_metrics.pl groupfile=./cells_group

exadata_cell_metrics,cell=cell1,metric_name=CD_BY_FC_DIRTY,metricObjectName=CD_disk01_cell12,metric_type=Instantaneous,metric_unit=MB metric_value=0.000
exadata_cell_metrics,cell=cell1,metric_name=CD_BY_FC_DIRTY,metricObjectName=CD_disk02_cell12,metric_type=Instantaneous,metric_unit=MB metric_value=0.000
exadata_cell_metrics,cell=cell1,metric_name=CD_BY_FC_DIRTY,metricObjectName=CD_disk03_cell12,metric_type=Instantaneous,metric_unit=MB metric_value=0.000
exadata_cell_metrics,cell=cell1,metric_name=CD_BY_FC_DIRTY,metricObjectName=CD_disk04_cell12,metric_type=Instantaneous,metric_unit=MB metric_value=0.000
exadata_cell_metrics,cell=cell1,metric_name=CD_BY_FC_DIRTY,metricObjectName=CD_disk05_cell12,metric_type=Instantaneous,metric_unit=MB metric_value=0.000
exadata_cell_metrics,cell=cell1,metric_name=CD_BY_FC_DIRTY,metricObjectName=CD_disk06_cell12,metric_type=Instantaneous,metric_unit=MB metric_value=0.000
exadata_cell_metrics,cell=cell1,metric_name=CD_BY_FC_DIRTY,metricObjectName=CD_disk07_cell12,metric_type=Instantaneous,metric_unit=MB metric_value=0.000
exadata_cell_metrics,cell=cell1,metric_name=CD_BY_FC_DIRTY,metricObjectName=CD_disk08_cell12,metric_type=Instantaneous,metric_unit=MB metric_value=0.000
exadata_cell_metrics,cell=cell1,metric_name=CD_BY_FC_DIRTY,metricObjectName=CD_disk09_cell12,metric_type=Instantaneous,metric_unit=MB metric_value=0.000
exadata_cell_metrics,cell=cell1,metric_name=CD_BY_FC_DIRTY,metricObjectName=CD_disk10_cell12,metric_type=Instantaneous,metric_unit=MB metric_value=0.000
exadata_cell_metrics,cell=cell1,metric_name=CD_BY_FC_DIRTY,metricObjectName=FD_00_cell12,metric_type=Instantaneous,metric_unit=MB metric_value=0.000
exadata_cell_metrics,cell=cell1,metric_name=CD_BY_FC_DIRTY,metricObjectName=FD_01_cell12,metric_type=Instantaneous,metric_unit=MB metric_value=0.000
exadata_cell_metrics,cell=cell1,metric_name=CD_IO_BY_R_LG_SEC,metricObjectName=CD_disk01_cell12,metric_type=Rate,metric_unit=MB/sec metric_value=0.000
exadata_cell_metrics,cell=cell1,metric_name=CD_IO_BY_R_LG_SEC,metricObjectName=CD_disk02_cell12,metric_type=Rate,metric_unit=MB/sec metric_value=0.000
exadata_cell_metrics,cell=cell1,metric_name=CD_IO_BY_R_LG_SEC,metricObjectName=CD_disk03_cell12,metric_type=Rate,metric_unit=MB/sec metric_value=0.000
exadata_cell_metrics,cell=cell1,metric_name=CD_IO_BY_R_LG_SEC,metricObjectName=CD_disk04_cell12,metric_type=Rate,metric_unit=MB/sec metric_value=0.000
exadata_cell_metrics,cell=cell1,metric_name=CD_IO_BY_R_LG_SEC,metricObjectName=CD_disk05_cell12,metric_type=Rate,metric_unit=MB/sec metric_value=0.000
exadata_cell_metrics,cell=cell1,metric_name=CD_IO_BY_R_LG_SEC,metricObjectName=CD_disk06_cell12,metric_type=Rate,metric_unit=MB/sec metric_value=0.000
exadata_cell_metrics,cell=cell1,metric_name=CD_IO_BY_R_LG_SEC,metricObjectName=CD_disk07_cell12,metric_type=Rate,metric_unit=MB/sec metric_value=0.000
exadata_cell_metrics,cell=cell1,metric_name=CD_IO_BY_R_LG_SEC,metricObjectName=CD_disk08_cell12,metric_type=Rate,metric_unit=MB/sec metric_value=0.000
exadata_cell_metrics,cell=cell1,metric_name=CD_IO_BY_R_LG_SEC,metricObjectName=CD_disk09_cell12,metric_type=Rate,metric_unit=MB/sec metric_value=0.000
exadata_cell_metrics,cell=cell1,metric_name=CD_IO_BY_R_LG_SEC,metricObjectName=CD_disk10_cell12,metric_type=Rate,metric_unit=MB/sec metric_value=0.000
exadata_cell_metrics,cell=cell1,metric_name=CD_IO_BY_R_LG_SEC,metricObjectName=FD_00_cell12,metric_type=Rate,metric_unit=MB/sec metric_value=0.000
exadata_cell_metrics,cell=cell1,metric_name=CD_IO_BY_R_LG_SEC,metricObjectName=FD_01_cell12,metric_type=Rate,metric_unit=MB/sec metric_value=0.000
.
.
.
- The output has been cut for readability.
- The groupfile parameter is mandatory: This file contains the list of the cells you want the metrics to be collected on.
On the database node, configure telegraf to execute the perl script with 60 seconds interval and send the output to InfluxDB. Edit the /etc/telegraf/telegraf.conf file so that it contains:
###############################################################################
#                            OUTPUT PLUGINS                                   #
###############################################################################

# Configuration for influxdb server to send metrics to
[[outputs.influxdb]]
urls = ["http://influxgraf:8086"] # required
  database = "telegraf" # required
  precision = "s"
  timeout = "5s"

###############################################################################
#                                  INPUTS                                     #
###############################################################################

# Exadata metrics
[[inputs.exec]]
  # Shell/commands array
  commands = ["/home/oracle/scripts/exadata_metrics.sh"]
  # Data format to consume. This can be "json", "influx" or "graphite" (line-protocol)
  # NOTE json only reads numerical measurements, strings and booleans are ignored.
  data_format = "influx"
  interval = "60s"
The exadata_metrics.sh script contains the call to the perl script:
$> cat exadata_metrics.sh
#!/bin/env bash

export ORACLE_HOME=/u01/app/oracle/product/12.1.0/dbhome_1
export PATH=$PATH:/home/oracle/scripts

perl /home/oracle/scripts/influxdb_exadata_metrics.pl groupfile=/home/oracle/scripts/cells_group
Now you can connect to grafana and create a new dashboard with the Exadata cells metrics the way you want to.
Example
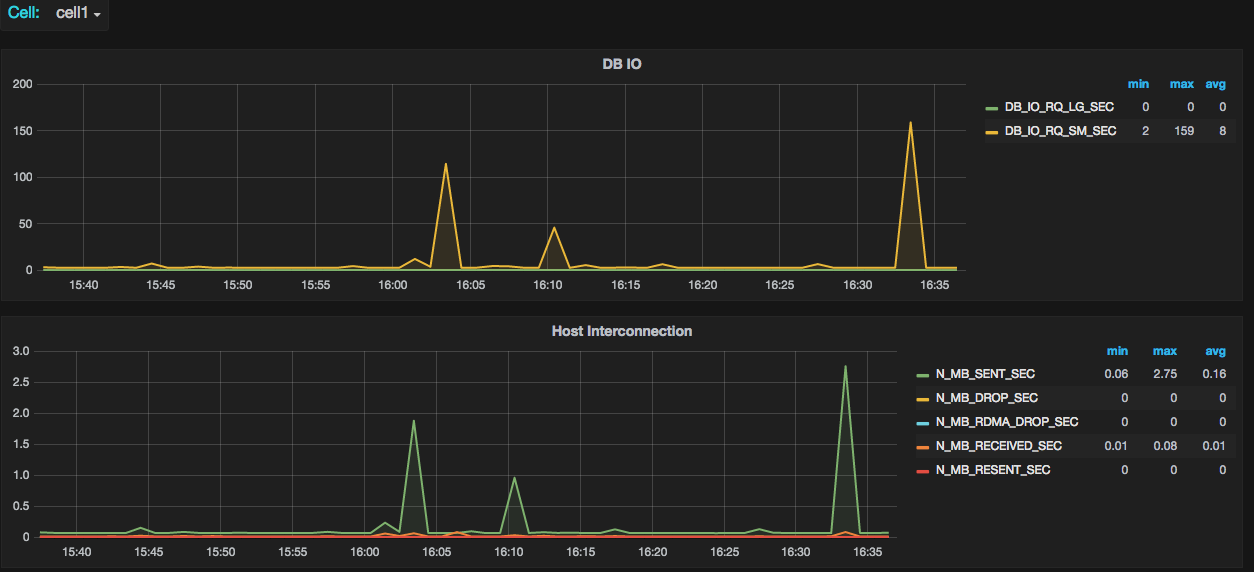
Remark
Nothing has been installed on the cells to collect those metrics with telegraf.
Conclusion
Thanks to:
- telegraf and InfluxDB, we are able to collect and store the Exadata cells metrics we want to.
- grafana, we are able to visualise the Exadata cells metrics the way we want to.