Introduction
Auditing the oracle database may lead to a wide variety of information.
What about having all this information centralized? What about having the possibility to gather, format, search, analyze and visualize this information in near real time?
To achieve this, let’s use the ELK stack:
- Logstash to collect the information the way we want to.
- Elasticsearch as an analytics engine.
- Kibana to visualize the data.
We’ll focus on the audit information coming from:
- The dba_audit_trail oracle view.
- The audit files (linked to the audit_file_dest parameter).
You should first read this post: Push the oracle alert.log and listener.log into Elasticsearch and analyze/visualize their content with Kibana prior to this one. The reason is that the current post relies on it (as the current post gives less explanation about Installation, setup and so on).
Installation
The Installation of those 3 layers is the same as described into this blog post.
Configure logstash to push and format the dba_audit_trail records to elasticsearch the way we want to
To achieve this we’ll use the logstash’s JDBC input (Robin Moffatt provided an interesting use case and explanation of the logstash’s JDBC input into this blog post) so that:
- The @timestamp field is reflecting the timestamp at which audit information has been recorded (rather than when logstash read the information).
- It records the os_username, username, userhost, action_name, sessionid, returncode, priv_used and global_uid fields coming from the dba_audit_trail view into the elasticsearch.
- It traps the kind of authentification (database, directory password..) and external name (if any) from the comment_text field of the dba_audit_trail view.
To trap and format this information, let’s create an audit_database.conf configuration file that looks like:
input {
jdbc {
jdbc_validate_connection => true
jdbc_connection_string => "jdbc:oracle:thin:@localhost:1521/PBDT"
jdbc_user => "system"
jdbc_password => "bdtbdt"
jdbc_driver_library => "/u01/app/oracle/product/11.2.0/dbhome_1/jdbc/lib/ojdbc6.jar"
jdbc_driver_class => "Java::oracle.jdbc.driver.OracleDriver"
statement => "select os_username,username,userhost,timestamp,action_name,comment_text,sessionid,returncode,priv_used,global_uid from dba_audit_trail where timestamp > :sql_l
ast_value"
schedule => "*/2 * * * *"
}
}

filter {
# Set the timestamp to the one of dba_audit_trail
mutate { convert => [ "timestamp" , "string" ]}
date { match => ["timestamp", "ISO8601"]}

if [comment_text] =~ /(?i)Authenticated by/ {

grok {
match => [ "comment_text","^.*(?i)Authenticated by: (?<authenticated_by>.*?);.*$" ]
}

if [comment_text] =~ /(?i)EXTERNAL NAME/ {
grok {
match => [ "comment_text","^.*(?i)EXTERNAL NAME: (?<external_name>.*?);.*$" ]
}
}
}

# remove temporary fields
mutate { remove_field => ["timestamp"] }
}

output {
elasticsearch {
hosts => ["elk:9200"]
index => "audit_databases_oracle-%{+YYYY.MM.dd}"
}
}
so that an entry into dba_audit_trail like:
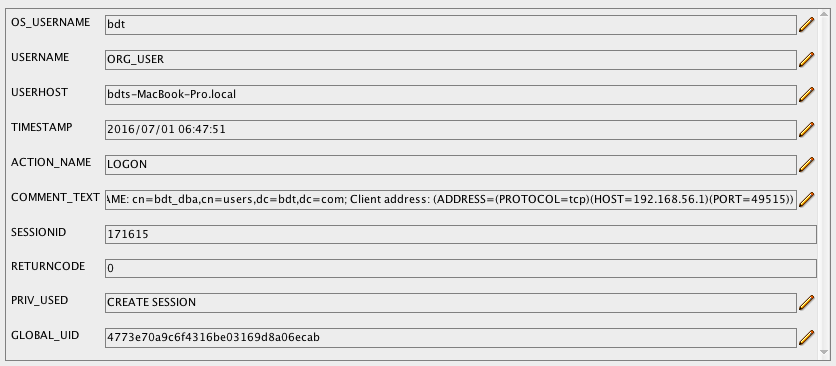
will be formatted and send to elasticsearch that way:
{
         "os_username" => "bdt",
            "username" => "ORG_USER",
            "userhost" => "bdts-MacBook-Pro.local",
         "action_name" => "LOGON",
        "comment_text" => "Authenticated by: DIRECTORY PASSWORD;EXTERNAL NAME: cn=bdt_dba,cn=users,dc=bdt,dc=com; Client address: (ADDRESS=(PROTOCOL=tcp)(HOST=192.168.56.1)(PORT=49515))",
           "sessionid" => 171615.0,
          "returncode" => 0.0,
           "priv_used" => "CREATE SESSION",
          "global_uid" => "4773e70a9c6f4316be03169d8a06ecab",
            "@version" => "1",
          "@timestamp" => "2016-07-01T06:47:51.000Z",
    "authenticated_by" => "DIRECTORY PASSWORD",
       "external_name" => "cn=bdt_dba,cn=users,dc=bdt,dc=com"
}
Configure logstash to push and format the *.aud files content to elasticsearch the way we want to
So that:
- The @timestamp field is reflecting the timestamp at which audit information has been recorded (rather than when logstash read the information).
- It records the action, the database user, the privilege, the client user, the client terminal, the status and the dbid into the elasticsearch.
To trap and format this information, let’s create an audit_files.conf configuration file that looks like:
input {
file {
path => "/u01/app/oracle/admin/PBDT/adump/*.aud"
}
}

filter {

# Join lines based on the time
multiline {
pattern => "%{DAY} %{MONTH} *%{MONTHDAY} %{TIME} %{YEAR}.*"
negate => true
what => "previous"
}

# Extract the date and the rest from the message
grok {
match => [ "message","%{DAY:day} %{MONTH:month} *%{MONTHDAY:monthday} %{TIME:time} %{YEAR:year}(?<audit_message>.*$)" ]
}

grok {
match => [ "audit_message","^.*ACTION :[[0-9]*] (?<action>.*?)DATABASE USER:[[0-9]*] (?<database_user>.*?)PRIVILEGE :[[0-9]*] (?<privilege>.*?)CLIENT USER:[[0-9]*] (?<cl ient_user>.*?)CLIENT TERMINAL:[[0-9]*] (?<client_terminal>.*?)STATUS:[[0-9]*] (?<status>.*?)DBID:[[0-9]*] (?<dbid>.*$?)" ]
}

if "_grokparsefailure" in [tags] { drop {} }

mutate {
add_field => {
"timestamp" => "%{year} %{month} %{monthday} %{time}"
}
}

# replace the timestamp by the one coming from the audit file
date {
locale => "en"
match => [ "timestamp" , "yyyy MMM dd HH:mm:ss" ]
}

# remove temporary fields
mutate { remove_field => ["audit_message","day","month","monthday","time","year","timestamp"] }

}

output {
elasticsearch {
hosts => ["elk:9200"]
index => "audit_databases_oracle-%{+YYYY.MM.dd}"
}
}
so that an audit file content like:
Fri Jul  1 07:13:56 2016 +02:00
LENGTH : '160'
ACTION :[7] 'CONNECT'
DATABASE USER:[1] '/'
PRIVILEGE :[6] 'SYSDBA'
CLIENT USER:[6] 'oracle'
CLIENT TERMINAL:[5] 'pts/1'
STATUS:[1] '0'
DBID:[10] '3270644858'
will be formatted and send to elasticsearch that way:
{
            "message" => "Fri Jul  1 07:13:56 2016 +02:00\nLENGTH : '160'\nACTION :[7] 'CONNECT'\nDATABASE USER:[1] '/'\nPRIVILEGE :[6] 'SYSDBA'\nCLIENT USER:[6] 'oracle'\nCLIENT TERMINAL:[5] 'pts/1'\nSTATUS:[1] '0'\nDBID:[10] '3270644858'\n",
           "@version" => "1",
         "@timestamp" => "2016-07-01T07:13:56.000Z",
               "path" => "/u01/app/oracle/admin/PBDT/adump/PBDT_ora_2387_20160701071356285876143795.aud",
               "host" => "Dprima",
               "tags" => [
        [0] "multiline"
    ],
             "action" => "'CONNECT'\n",
      "database_user" => "'/'\n",
          "privilege" => "'SYSDBA'\n",
        "client_user" => "'oracle'\n",
    "client_terminal" => "'pts/1'\n",
             "status" => "'0'\n",
               "dbid" => "'3270644858'\n"
}
Analyze and Visualize the data with Kibana
The Kibana configuration has already been described into this blog post.
Let’s see 2 examples of audit data visualisation:
- Example 1: thanks to the dba_audit_trail data, let’s graph the connection repartition to our databases by authentification type, username and returncode:
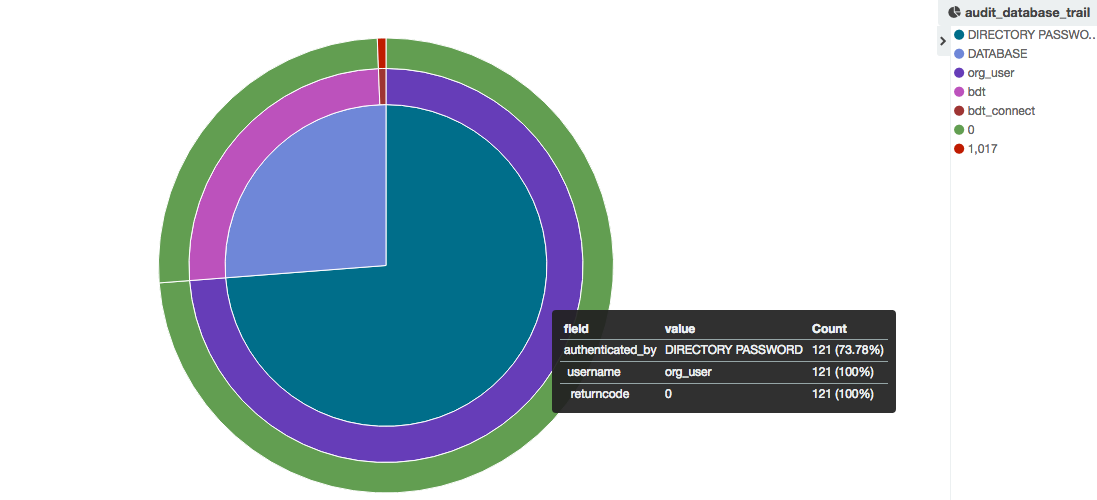
As we can see most of the connections are authenticated by Directory Password and are successful.
- Example 2: thanks to the *.aud files data, let’s graph the sysdba connection over time and their status:
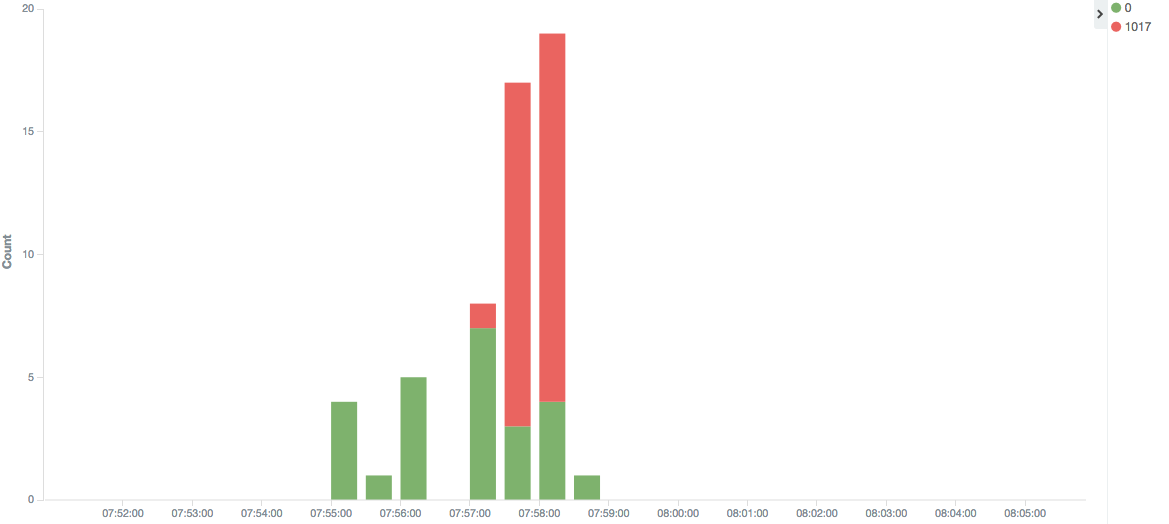
As we can see, some of the sysdba connections are not successful between 07:57 am and 7:58 am. Furthermore the number of unsuccessful connections is greater than the number of successful ones.
Conclusion
Thanks to the ELK stack you can gather, centralize, analyze and visualize the oracle audit data for your whole datacenter the way you want to.