Introduction
The purpose of this blog post is to introduce pg_shmemviz, a new tool to visualize PostgreSQL shared memory.
It follows the same approach as pg_walviz, bringing physical layout and byte level navigation to PostgreSQL shared memory instead of WAL segments.
Views such as pg_shmem_allocations, pg_buffercache and
pg_shmem_allocations_numa are useful to inspect selected aspects of shared
memory. However, sometimes we also want to see where allocations are physically
located, which C structures they contain, their exact fields and padding, the
regions reached through pointers and the corresponding raw bytes.
Welcome to pg_shmemviz
pg_shmemviz is a development and debugging tool that captures PostgreSQL’s main and dynamic shared memory segments into an offline snapshot and displays them in a local browser.
The interface combines a shared memory map, an allocation table, a structure inspector and a Physical Bytes view. They are synchronized: selecting an allocation, structure field or byte updates the other views. Pointer and history navigation can also cross captured segments.
As a picture is worth a thousand words, let’s have a look at it:
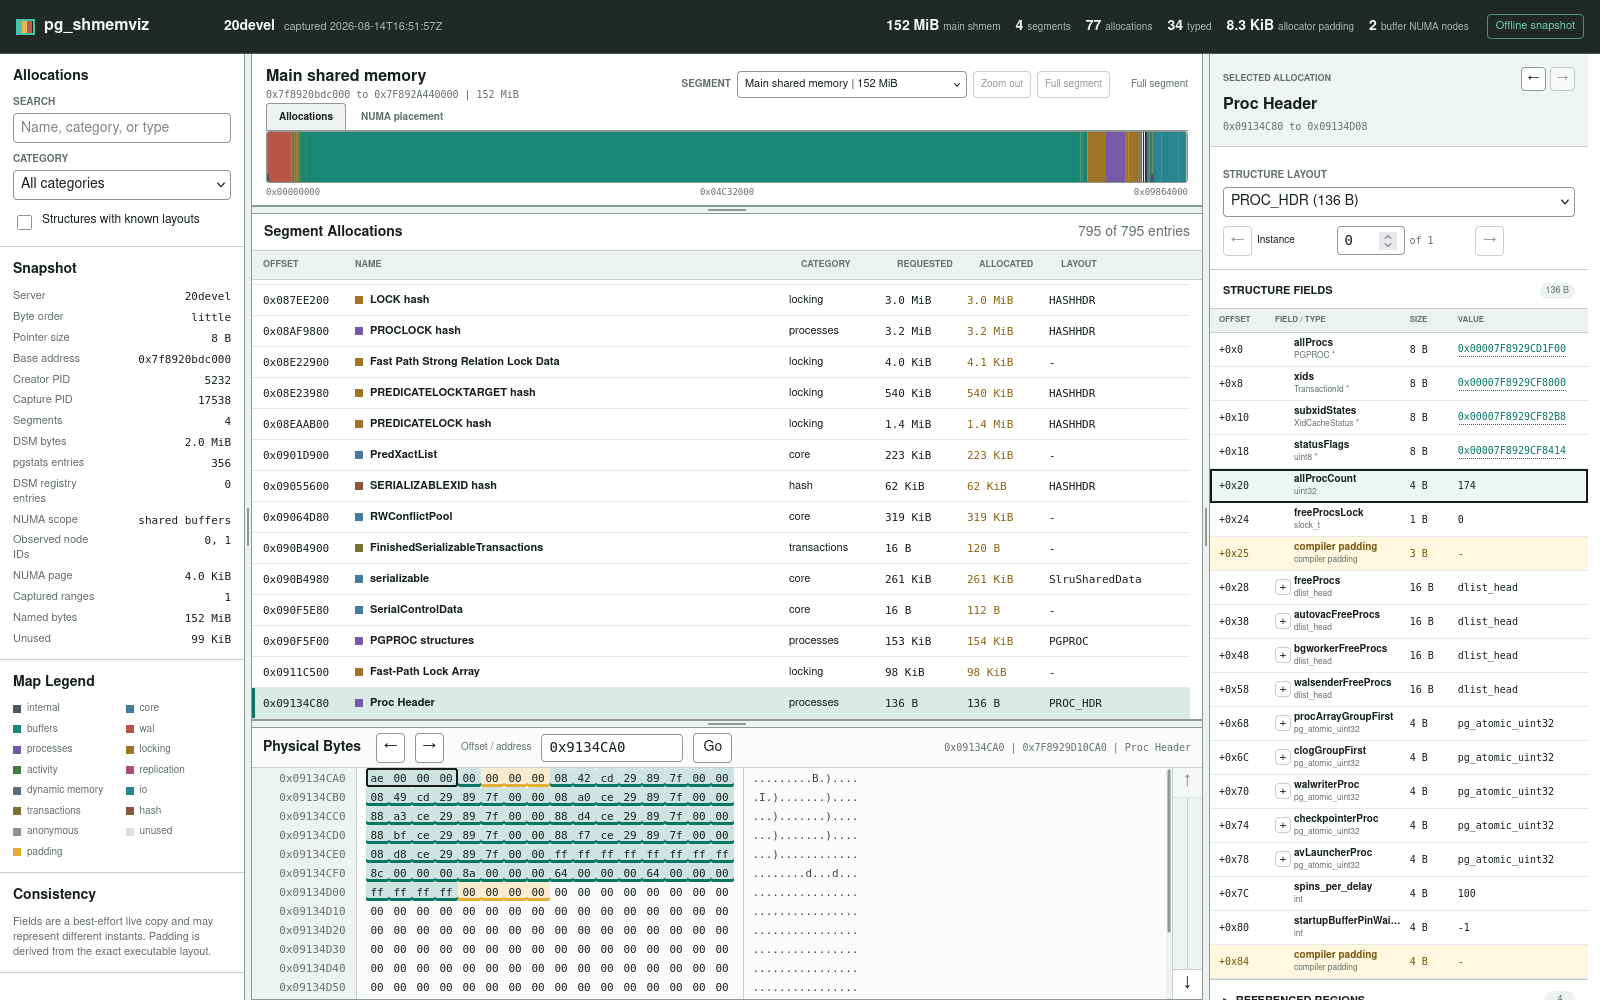
Shared memory overview
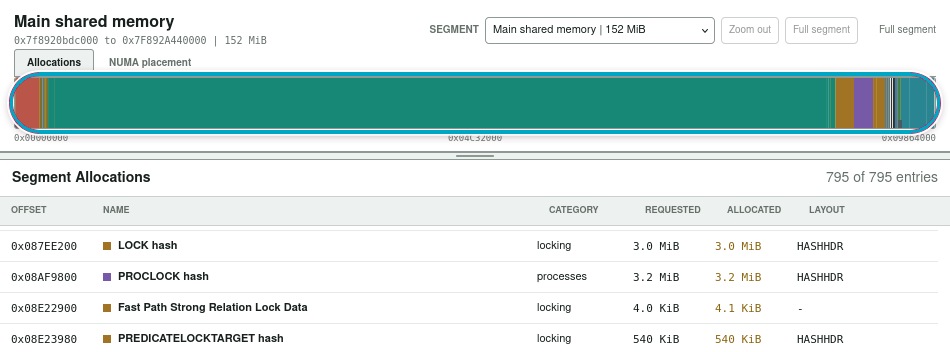
The map displays named allocations, allocator padding and unused ranges. Main shared memory, DSM control, DSM and DSA segments can be selected independently. One can filter the allocation table, select an allocation or zoom into a physical range.
Structure Fields and padding
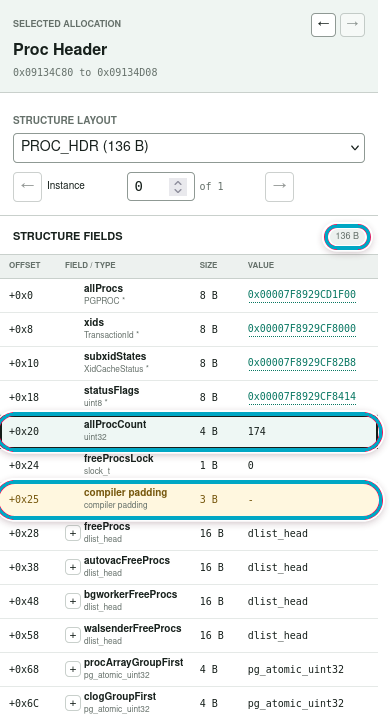
The Structure Fields panel uses DWARF from the exact postgres executable to
display nested C structures, field offsets, values, compiler padding and array
stride padding.
Pointer targets with known bounds appear as referenced regions. Selecting one highlights its source pointer and opens the target bytes. Specialized discovery covers PostgreSQL statistics, WAL, process, SLRU, dynahash and DSM registry structures.
Physical Bytes
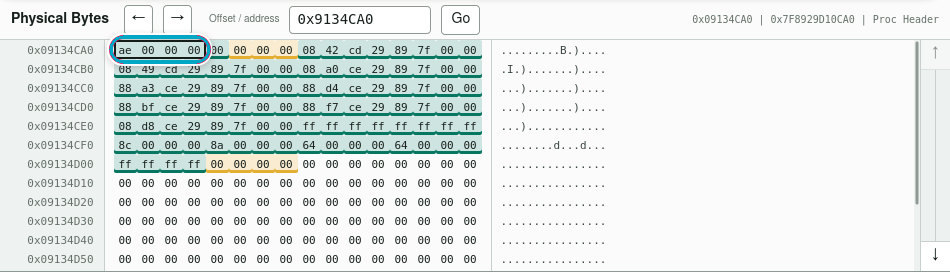
The Physical Bytes panel displays bounded byte windows classified by structure field and padding. Selecting a byte finds its deepest known field, while selecting a field brackets its bytes. Moving the mouse over a byte displays its address, offset, value, structure field, NUMA node and comparison information when available.
Buffer Cache
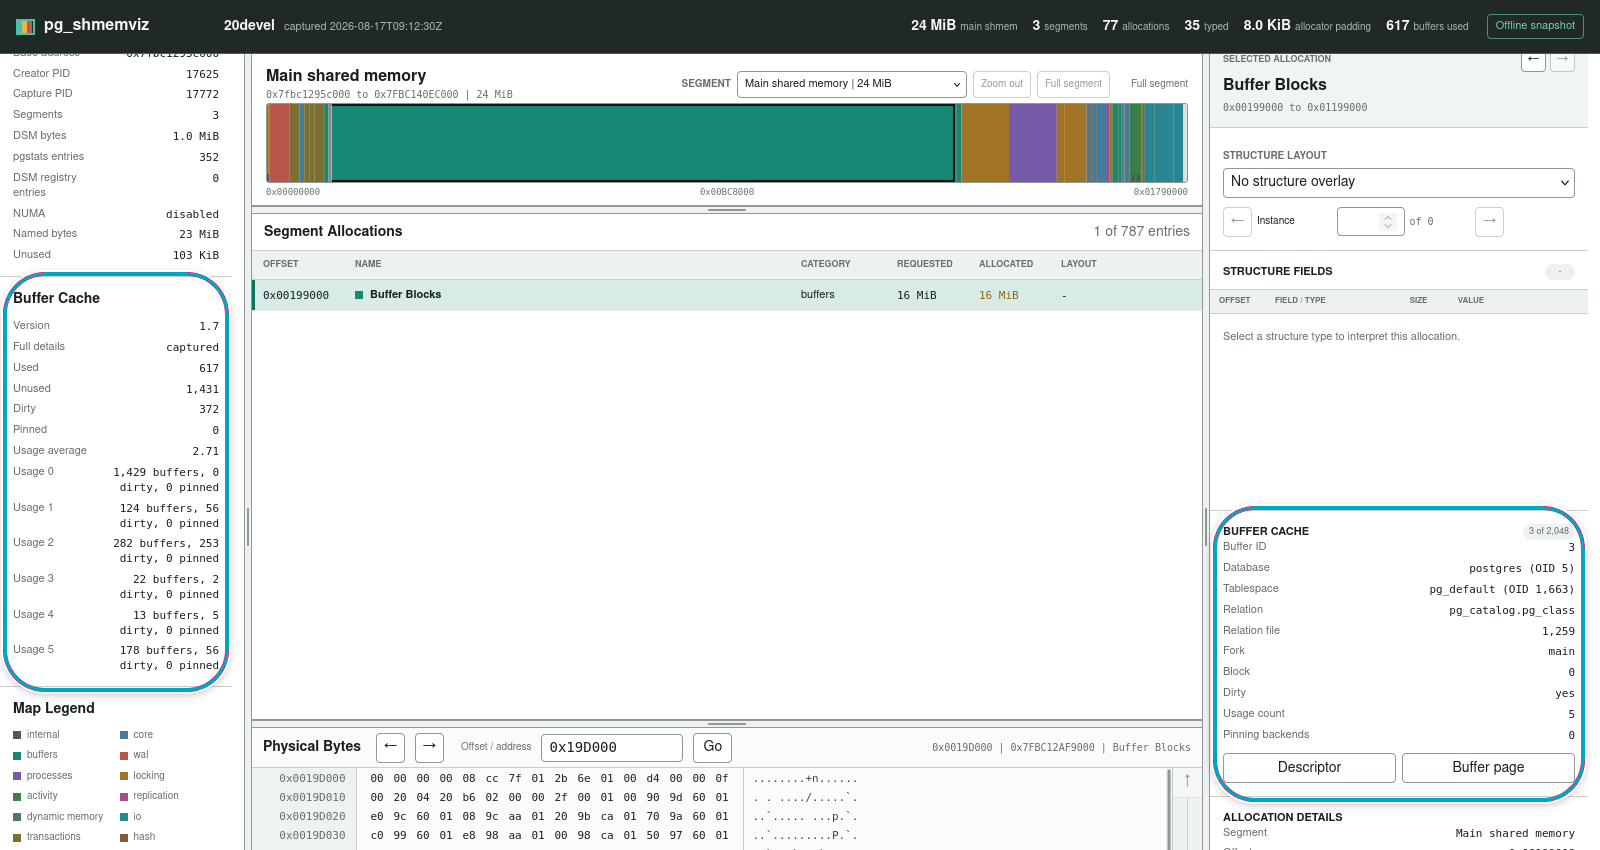
When pg_buffercache is installed, the snapshot includes a buffer cache
summary. Optional per buffer details report the buffer identifier, database,
tablespace, relation, fork, block, dirty state, usage count and pinning
backends. Resolved object names and direct navigation between a buffer
descriptor and its page can also be captured.
Dynamic shared memory and DSA
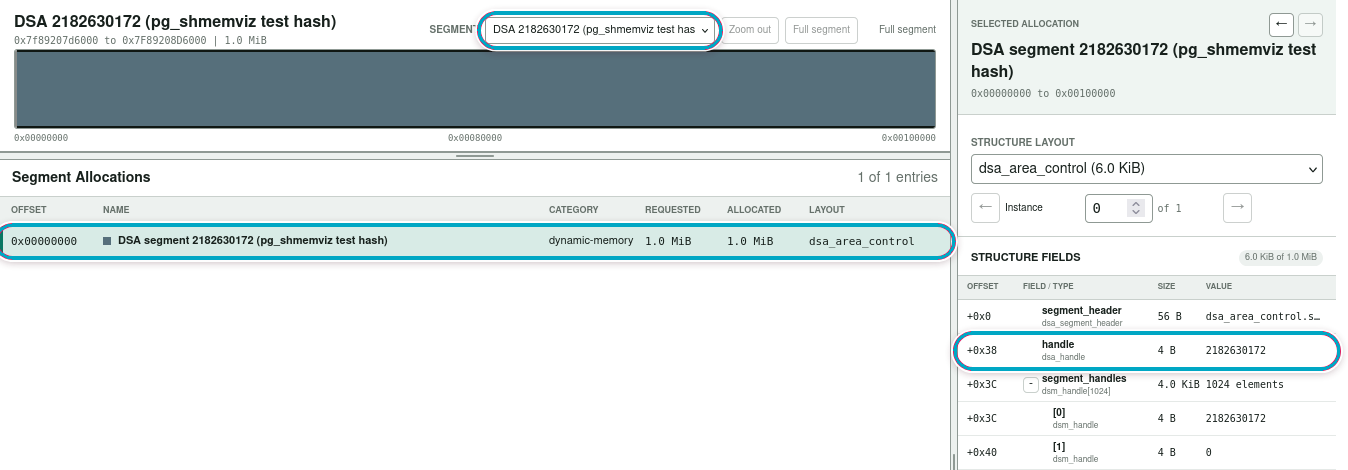
Dynamic shared memory segments are displayed separately from the main segment. DSM registry names identify plain DSM segments, named DSA areas and DSA areas backing known dshash tables.
NUMA placement
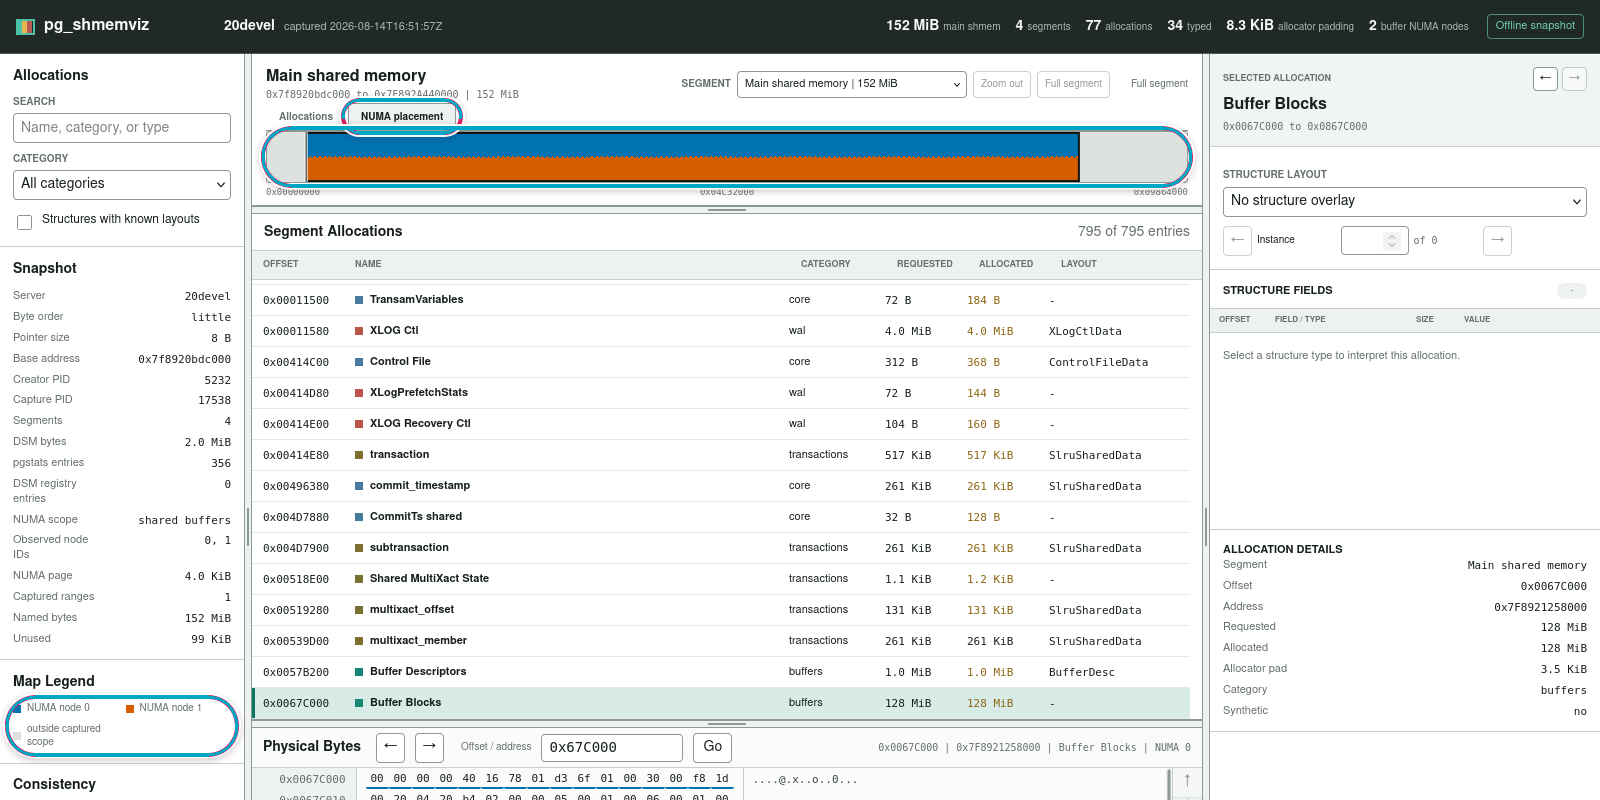
On a PostgreSQL build with --with-libnuma, the map can display captured page
placement. NUMA information is also propagated to allocations, structure
instances, fields, referenced regions and physical bytes. A range crossing a
page boundary can therefore show several nodes.
The default scope captures ProcGlobal->allProcs. The shared buffers or all
named main shared memory allocations can also be requested explicitly.
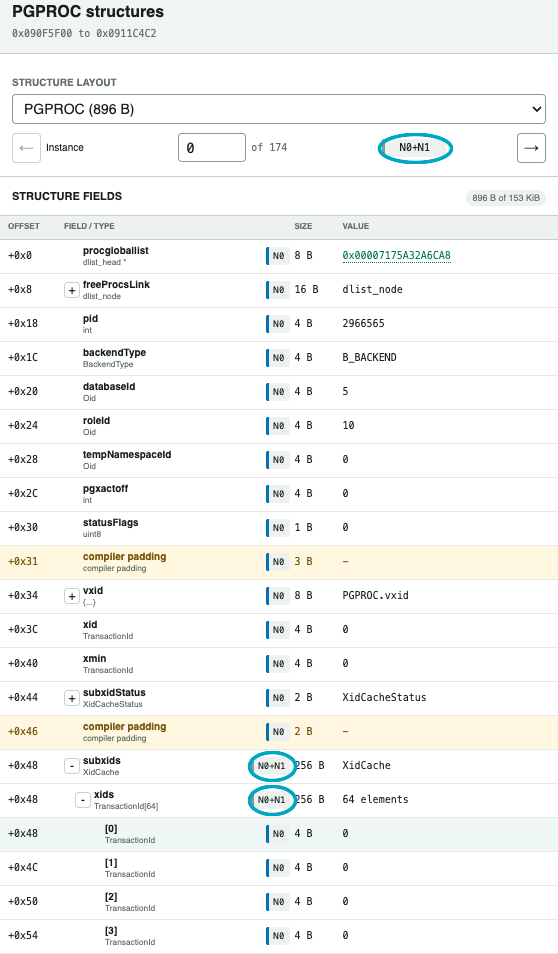
In this capture from a multi node host, the selected PGPROC spans nodes 0
and 1. Its subxids member and nested xids array also cross the page
boundary. Individual array elements show their own placement, so an element
can show N0 while its parent shows N0+N1.
Snapshot comparison
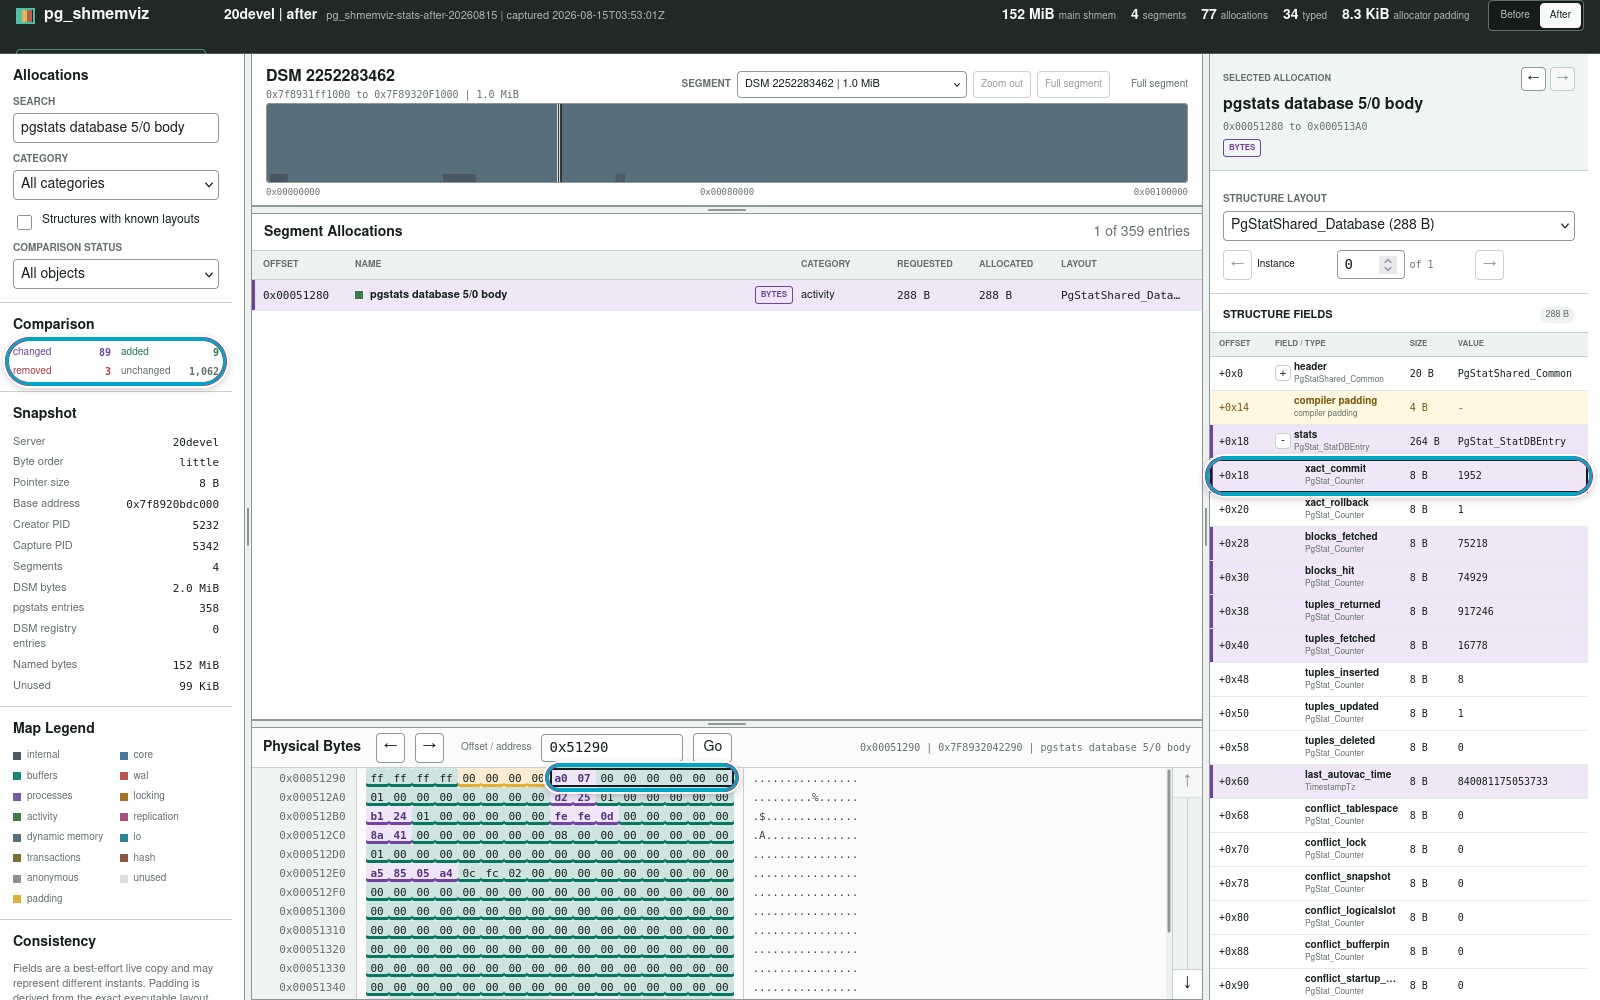
Two compatible snapshots can be compared at allocation, field and byte levels. The Before and After control preserves matched selections while navigating between both captures.
In this example, xact_commit changes from 1736 to 1952. The selected
eight-byte field is outlined in the Physical Bytes view, while purple marks
only the bytes whose stored values changed.
How to use it
The current release is v0.1.0-beta.1 and can be found in this
repository.
Do not run
pg_shmemvizon a production PostgreSQL instance. It is intended only for development and debugging on a disposable or otherwise isolated instance.
The PostgreSQL server must have debug information, and its matching
pg_config, postgres executable and development files must be available.
The tool uses LLDB on macOS and GDB elsewhere. The debugger reads DWARF from
the executable and does not attach to the running server.
Build and install the extension with:
cd ~/pg_shmemviz
make PG_CONFIG=/path/to/postgres-install/bin/pg_config
make PG_CONFIG=/path/to/postgres-install/bin/pg_config install
Then create the extension in the database used for capture:
/path/to/postgres-install/bin/psql -d postgres \
  -c 'CREATE EXTENSION pg_shmemviz'
Create a snapshot with:
~/pg_shmemviz/bin/pg_shmemviz capture \
  --pg-config /path/to/postgres-install/bin/pg_config \
  --dbname postgres \
  /path/to/new-snapshot
The viewer can then be started with:
~/pg_shmemviz/bin/pg_shmemviz serve /path/to/new-snapshot
It starts a local HTTP server, opens the browser and binds to
127.0.0.1:8765 by default.
Two snapshots can be compared with:
~/pg_shmemviz/bin/pg_shmemviz serve \
  /path/to/before-snapshot \
  /path/to/after-snapshot
For a remote or headless development server, one can use:
~/pg_shmemviz/bin/pg_shmemviz serve \
  --no-open --port 8765 /path/to/new-snapshot
and create an SSH tunnel from the workstation:
ssh -N -L 8765:127.0.0.1:8765 user@server
Then http://127.0.0.1:8765/ can be opened locally.
Remarks
- A capture is a sequential, lock free copy of live shared memory. PostgreSQL continues to modify it, so related fields can represent different instants and a multi byte non atomic field can be torn.
- Structure layouts require the exact
postgresexecutable used by the captured server. - The complete main shared memory segment is copied, including shared buffers and unused reserved space. Snapshots can therefore be large and contain sensitive data.
- NUMA capture can fault untouched pages and establish their first touch placement.
pg_buffercachemetadata and the copied shared memory bytes can represent different instants.- The viewer has no authentication, authorization or TLS. It should remain on loopback, with an SSH tunnel used for remote access.
- Automatic structure discovery depends on PostgreSQL internal names and has currently been validated against PostgreSQL 20devel.
- Please refer to the README for the complete compatibility and limitations list.
Conclusion
pg_shmemviz is a new utility that can be used to visualize PostgreSQL shared memory, from complete segments and named allocations down to C structure fields, padding and raw bytes.
Optional pg_buffercache and NUMA information add more context, while snapshot
comparison helps identify what changed between two captures.
This is a first beta release for development and debugging, and feedback is welcome.