Introduction
As a picture is worth a thousand words, we may want to visualise the oracle performance metrics. There is already several tools to do so, but what if you could do it the way you want? build your own graph? Let’s try to achieve this with 3 layers:
- telegraf: to collect the oracle metrics
- InfluxDB: to store the time-series oracle metrics
- grafana: to visualise the oracle time-series metrics
Installation
Let’s install InfluxDB and grafana that way (for example on the same host, namely influxgraf):
- Install InfluxDB (detail here):
[root@influxgraf ~]# wget https://s3.amazonaws.com/influxdb/influxdb-0.10.2-1.x86_64.rpm

[root@influxgraf ~]# yum localinstall influxdb-0.10.2-1.x86_64.rpm
- Install grafana (detail here):
[root@influxgraf ~]# yum install https://grafanarel.s3.amazonaws.com/builds/grafana-2.6.0-1.x86_64.rpm
Let’s install telegraf on the oracle host (namely Dprima) that way (detail here):
[root@Dprima ~]# wget http://get.influxdb.org/telegraf/telegraf-0.10.4.1-1.x86_64.rpm

[root@Dprima ~]# yum localinstall telegraf-0.10.4.1-1.x86_64.rpm
Setup
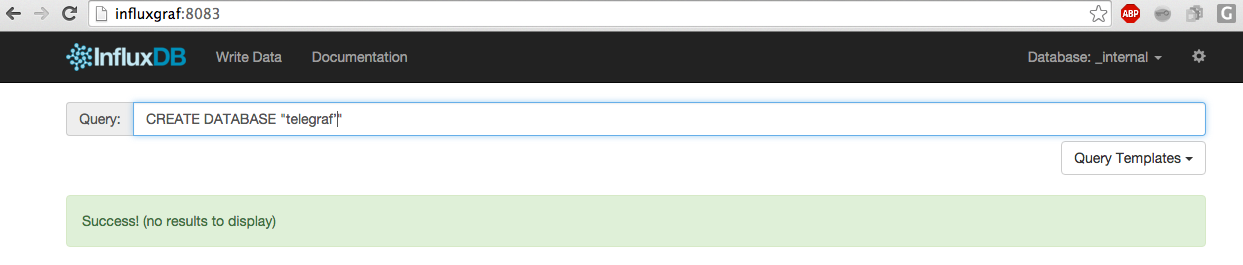
- Create a telegraf database into InfluxDB (using the web interface):
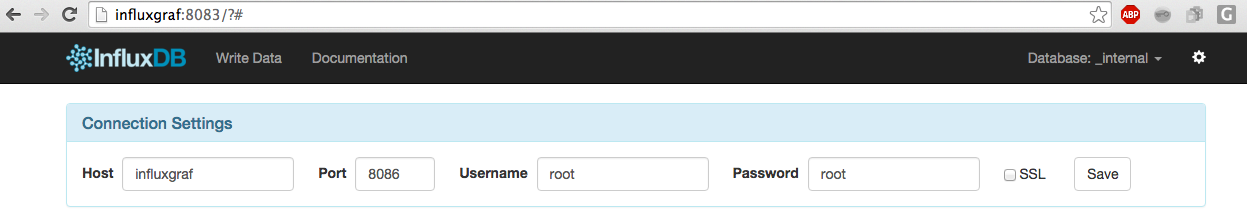
- Create a root user into InfluxDB (using the web interface):
- Write a script to collect the oracle metrics. I am using python but this is not mandatory at all. Only the output of the script does matter, it has to be InfluxDB line-protocol. The script query the v$sysmetric and v$eventmetric views to get the wait class and the wait event metrics during the last minute. I am not reinventing the wheel, I am using Kyle Hailey’s queries. The python code is:
[oracle@Dprima scripts]$ cat oracle_metrics.py
import os
import sys
import cx_Oracle
import argparse
import re

class OraMetrics():
def __init__(self, user, passwd, sid):
import cx_Oracle
self.user = user
self.passwd = passwd
self.sid = sid
self.connection = cx_Oracle.connect( self.user , self.passwd , self.sid )
cursor = self.connection.cursor()
cursor.execute("select HOST_NAME from v$instance")
for hostname in cursor:
self.hostname = hostname[0]

def waitclassstats(self, user, passwd, sid):
cursor = self.connection.cursor()
cursor.execute("""
select n.wait_class, round(m.time_waited/m.INTSIZE_CSEC,3) AAS
from v$waitclassmetric m, v$system_wait_class n
where m.wait_class_id=n.wait_class_id and n.wait_class != 'Idle'
union
select 'CPU', round(value/100,3) AAS
from v$sysmetric where metric_name='CPU Usage Per Sec' and group_id=2
union select 'CPU_OS', round((prcnt.busy*parameter.cpu_count)/100,3) - aas.cpu
from
( select value busy
from v$sysmetric
where metric_name='Host CPU Utilization (%)'
and group_id=2 ) prcnt,
( select value cpu_count from v$parameter where name='cpu_count' ) parameter,
( select 'CPU', round(value/100,3) cpu from v$sysmetric where metric_name='CPU Usage Per Sec' and group_id=2) aas
""")
for wait in cursor:
wait_name = wait[0]
wait_value = wait[1]
print "oracle_wait_class,host=%s,db=%s,wait_class=%s wait_value=%s" % (self.hostname, sid,re.sub(' ', '_', wait_name), wait_value )

def waitstats(self, user, passwd, sid):
cursor = self.connection.cursor()
cursor.execute("""
select
n.wait_class wait_class,
n.name wait_name,
m.wait_count cnt,
round(10*m.time_waited/nullif(m.wait_count,0),3) avgms
from v$eventmetric m,
v$event_name n
where m.event_id=n.event_id
and n.wait_class <> 'Idle' and m.wait_count > 0 order by 1 """)
for wait in cursor:
wait_class = wait[0]
wait_name = wait[1]
wait_cnt = wait[2]
wait_avgms = wait[3]
print "oracle_wait_event,host=%s,db=%s,wait_class=%s,wait_event=%s count=%s,latency=%s" % (self.hostname, sid,re.sub(' ', '_', wait_class),re.sub(' ', '_', wait_name)
, wait_cnt,wait_avgms)

if __name__ == "__main__":
parser = argparse.ArgumentParser()
parser.add_argument('-u', '--user', help="Username", required=True)
parser.add_argument('-p', '--passwd', required=True)
parser.add_argument('-s', '--sid', help="SID", required=True)

args = parser.parse_args()

stats = OraMetrics(args.user, args.passwd, args.sid)
stats.waitclassstats(args.user, args.passwd, args.sid)
stats.waitstats(args.user, args.passwd, args.sid)
The output looks like (the output format is the InfluxDB line-protocol):
[oracle@Dprima scripts]$ python "/home/oracle/scripts/oracle_metrics.py" "-u" "system" "-p" "bdtbdt" "-s" PBDT
oracle_wait_class,host=Dprima,db=PBDT,wait_class=Administrative wait_value=0
oracle_wait_class,host=Dprima,db=PBDT,wait_class=CPU wait_value=0
oracle_wait_class,host=Dprima,db=PBDT,wait_class=CPU_OS wait_value=0.035
oracle_wait_class,host=Dprima,db=PBDT,wait_class=Commit wait_value=0
oracle_wait_class,host=Dprima,db=PBDT,wait_class=Concurrency wait_value=0
oracle_wait_class,host=Dprima,db=PBDT,wait_class=Configuration wait_value=0
oracle_wait_class,host=Dprima,db=PBDT,wait_class=Network wait_value=0
oracle_wait_class,host=Dprima,db=PBDT,wait_class=Other wait_value=0
oracle_wait_class,host=Dprima,db=PBDT,wait_class=Scheduler wait_value=0
oracle_wait_class,host=Dprima,db=PBDT,wait_class=System_I/O wait_value=0.005
oracle_wait_class,host=Dprima,db=PBDT,wait_class=User_I/O wait_value=0
oracle_wait_event,host=Dprima,db=PBDT,wait_class=System_I/O,wait_event=control_file_sequential_read count=163,latency=0.009
oracle_wait_event,host=Dprima,db=PBDT,wait_class=System_I/O,wait_event=control_file_parallel_write count=60,latency=3.933
oracle_wait_event,host=Dprima,db=PBDT,wait_class=System_I/O,wait_event=log_file_parallel_write count=60,latency=1.35
oracle_wait_event,host=Dprima,db=PBDT,wait_class=User_I/O,wait_event=Disk_file_operations_I/O count=16,latency=0.037
oracle_wait_event,host=Dprima,db=PBDT,wait_class=User_I/O,wait_event=Parameter_File_I/O count=16,latency=0.004
- On the oracle host, configure telegraf to execute the python script with 60 seconds interval and send the output to InfluxDB. Edit the /etc/telegraf/telegraf.conf file so that it contains:
###############################################################################
#                                  OUTPUTS                                    #
###############################################################################

# Configuration for influxdb server to send metrics to
[[outputs.influxdb]]
  urls = ["http://influxgraf:8086"] # required
  database = "telegraf" # required
  precision = "s"
  timeout = "5s"


###############################################################################
#                                  INPUTS                                     #
###############################################################################

# Oracle metrics
[[inputs.exec]]
  # Shell/commands array
  commands = ["/home/oracle/scripts/oracle_metrics.sh"]
  # Data format to consume. This can be "json", "influx" or "graphite" (line-protocol)
  # NOTE json only reads numerical measurements, strings and booleans are ignored.
  data_format = "influx"
  interval = "60s"
The oracle_metrics.sh script contains the call to the python script:
#!/bin/env bash

export LD_LIBRARY_PATH=/u01/app/oracle/product/11.2.0/dbhome_1//lib
export ORACLE_HOME=/u01/app/oracle/product/11.2.0/dbhome_1/

python "/home/oracle/scripts/oracle_metrics.py" "-u" "system" "-p" "bdtbdt" "-s" PBDT
- Launch telegraf:
[root@Dprima ~]# telegraf -config /etc/telegraf/telegraf.conf
Graph the metrics
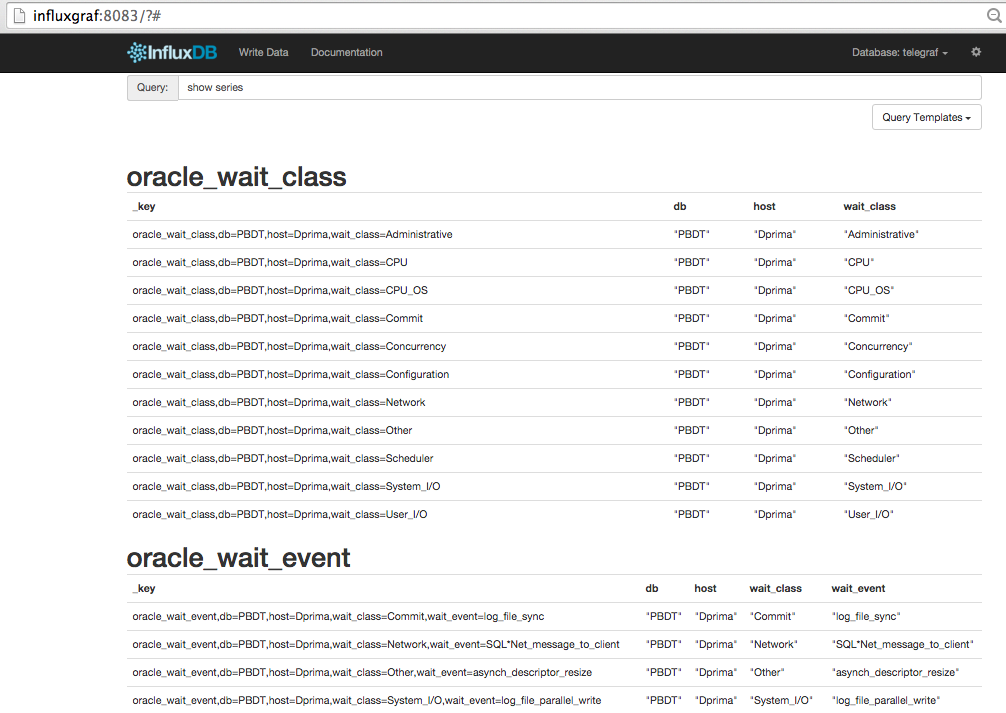
- First check that the metrics are stored the way we want into InfluxDB:
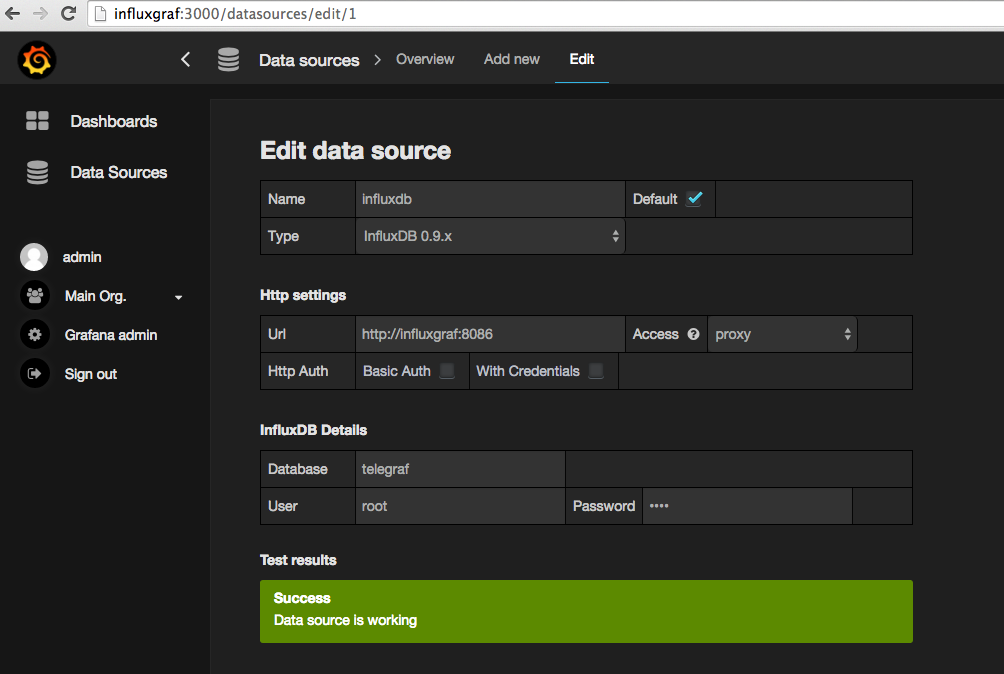
- Configure InfluxDB as datasource in grafana:
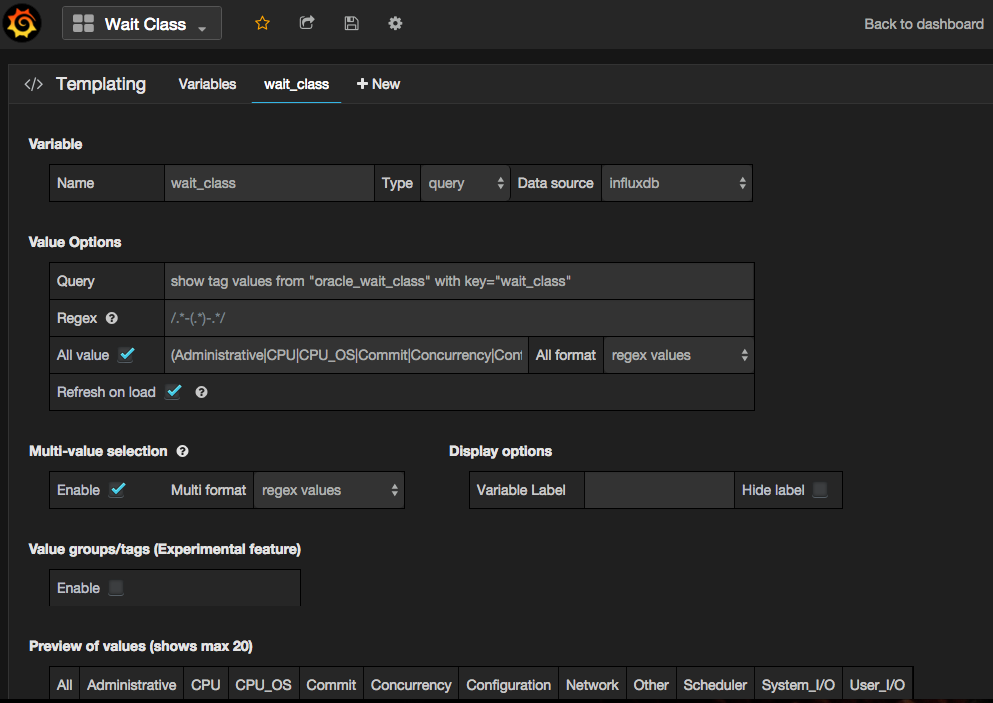
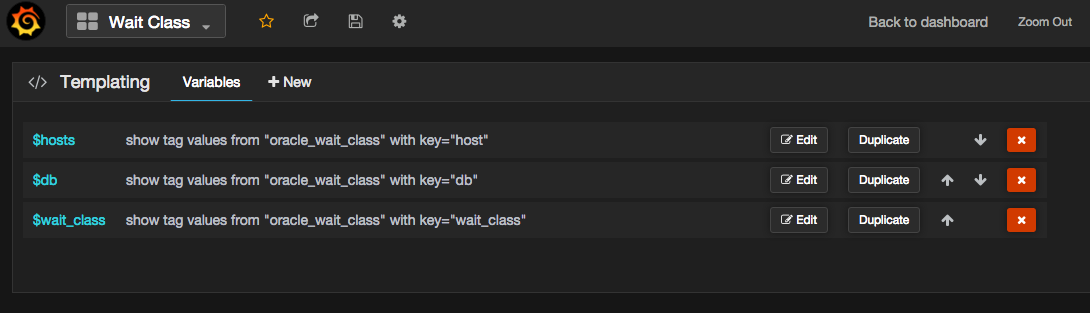
- In grafana, create a dashboard and create some variables (hosts, db and wait_class):
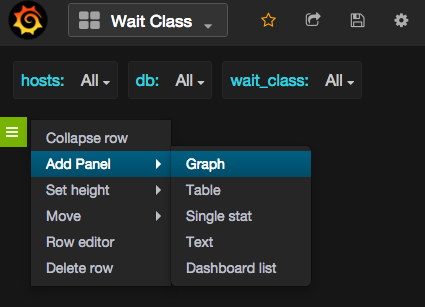
- Now let’s create a graph:
- Get the metrics:
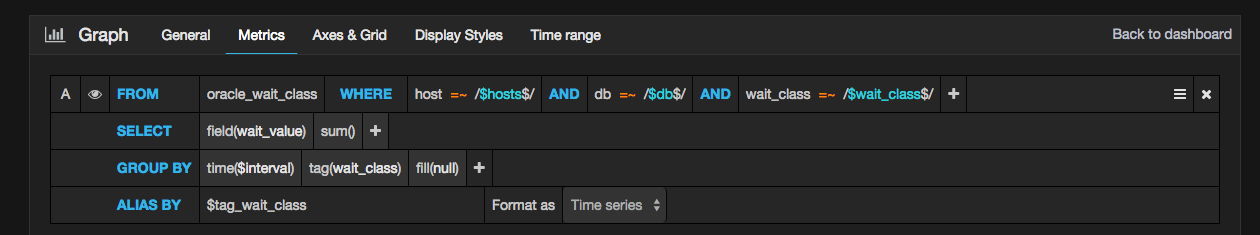
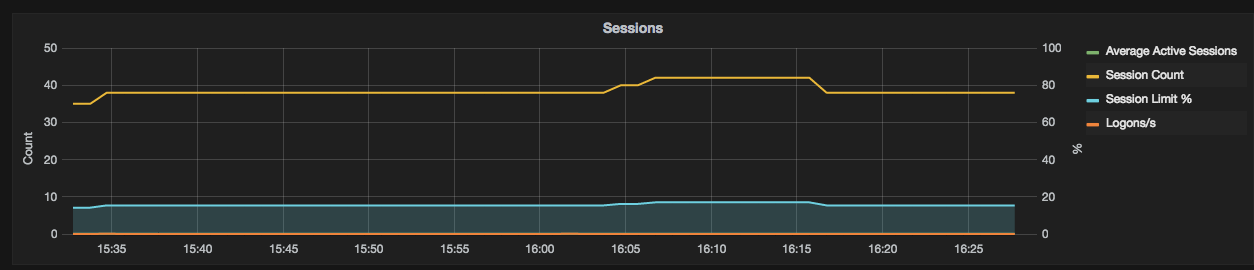
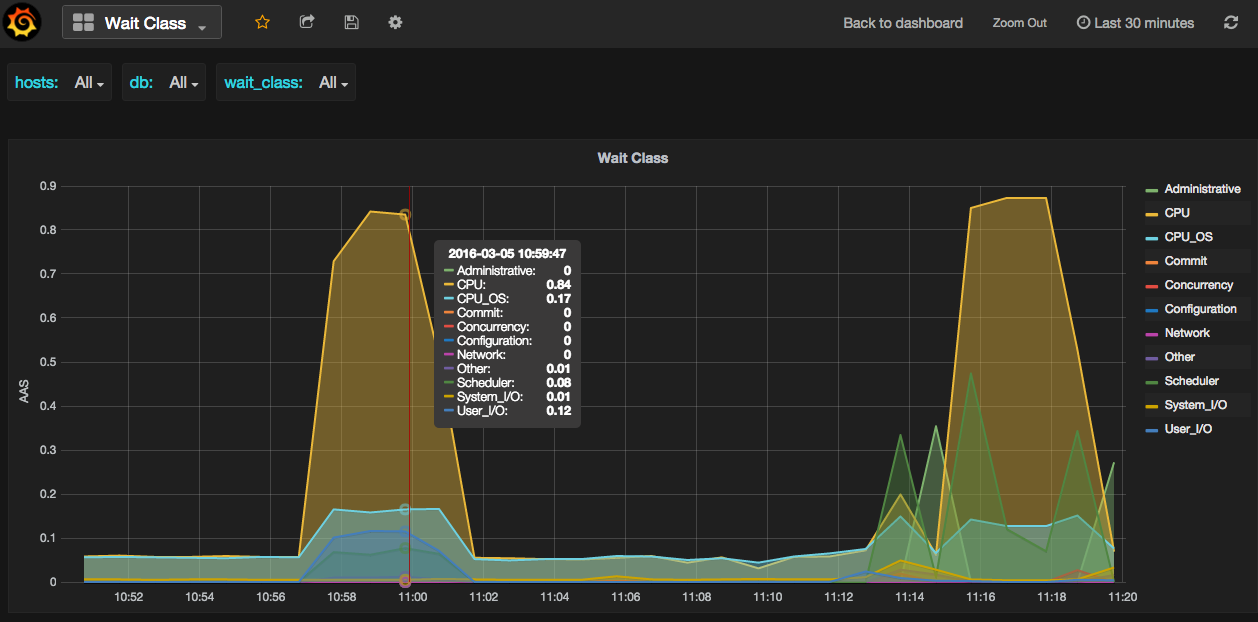
- So that the graph looks like:
Remarks
- Thanks to the variables defined in grafana, we can filter on the host, database and wait class (instead of visualising all of them).
- We can also graph the wait events we collected, or whatever you want to collect.
Conclusion
Thanks to:
- telegraf and InfluxDB, we are able to collect and store the metrics we want to.
- grafana, we are able to visualise the metrics the way we want to.
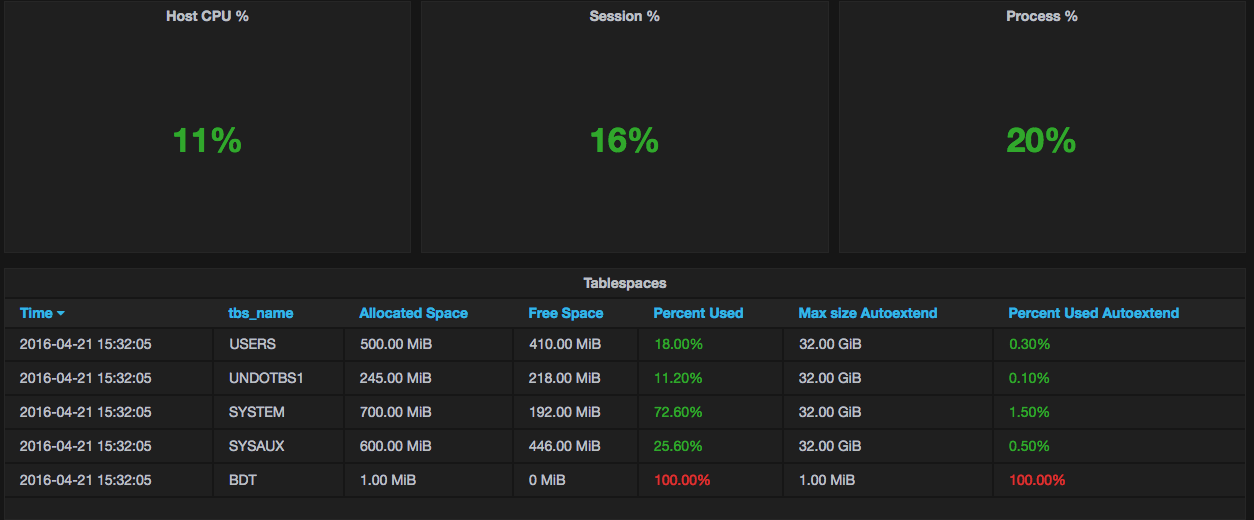
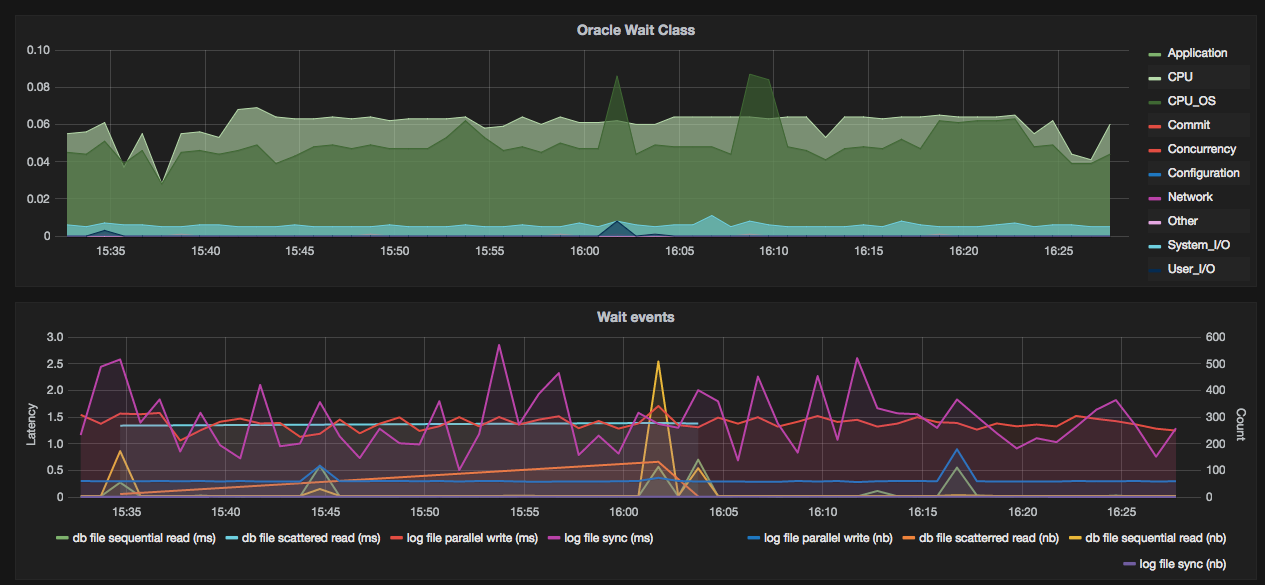
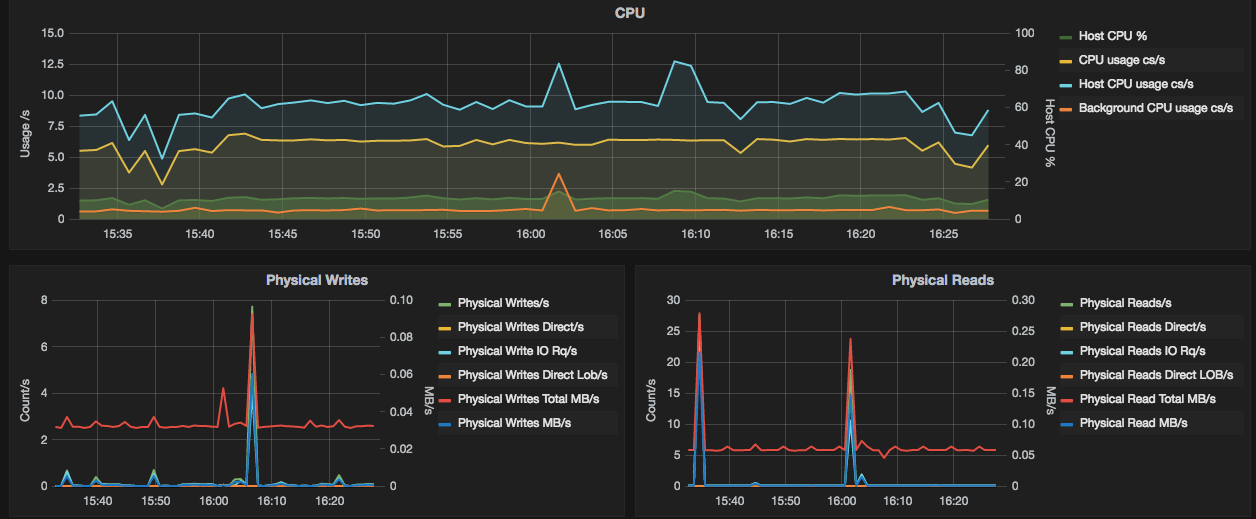
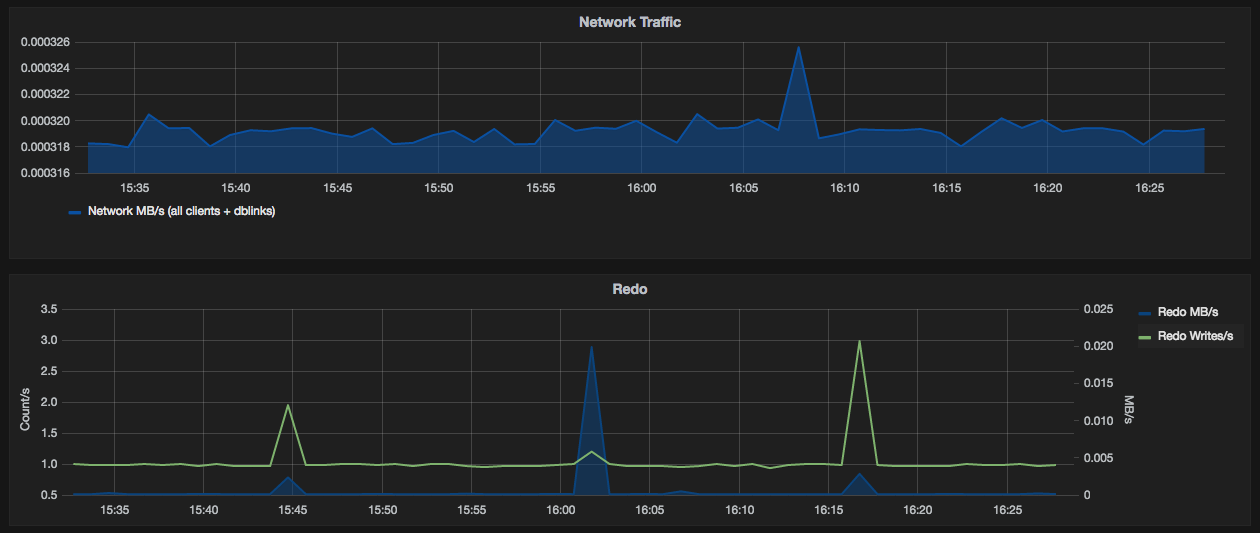
Update 04/21/2016:
As another example, with more informations collected: