Introduction
Cells metrics are very useful but their name are not so friendly. The name is a concatenation of abbreviations for the type of component, delimited by the underscore character. Then you have to understand the naming convention to understand the meaning of the metric name.
For example, knowing that:
- CD stands for “Cell Disks metrics”
- IO_BY stands for “Number of megabytes”
- R stands for Read
- LG stands for Large
You can conclude that the CD_IO_BY_R_LG metric is linked to the “Number of megabytes read in large blocks from a cell disk”.
Hopefully the metrics are explained into the Oracle Documentation and you can also retrieve their description from cellcli:
$ cellcli -e "list metricdefinition attributes name,description where name='CD_IO_BY_R_LG'"

CD_IO_BY_R_LG    "Number of megabytes read in large blocks from a cell disk"
Lack of description
That said, as an example, let’s query the current metric values for a particular database that way:
$ cellcli -e "list metriccurrent attributes metricObjectName,name,metricValue where name like 'DB.*' and metricObjectName='BDT'"

     BDT     DB_FC_IO_BY_SEC     0 MB/sec
     BDT     DB_FC_IO_RQ         47,638 IO requests
     BDT     DB_FC_IO_RQ_SEC     2.1 IO/sec
     BDT     DB_FD_IO_BY_SEC     0 MB/sec
     BDT     DB_FD_IO_LOAD       19,885
     BDT     DB_FD_IO_RQ_LG      36 IO requests
     BDT     DB_FD_IO_RQ_LG_SEC  0.0 IO/sec
     BDT     DB_FD_IO_RQ_SM      47,602 IO requests
     BDT     DB_FD_IO_RQ_SM_SEC  2.1 IO/sec
     BDT     DB_FL_IO_BY         0.000 MB
     BDT     DB_FL_IO_BY_SEC     0.000 MB/sec
     BDT     DB_FL_IO_RQ         0 IO requests
     BDT     DB_FL_IO_RQ_SEC     0.0 IO/sec
     BDT     DB_IO_BY_SEC        0 MB/sec
     BDT     DB_IO_LOAD          0.0
     BDT     DB_IO_RQ_LG         0 IO requests
     BDT     DB_IO_RQ_LG_SEC     0.0 IO/sec
     BDT     DB_IO_RQ_SM         19 IO requests
     BDT     DB_IO_RQ_SM_SEC     0.0 IO/sec
     BDT     DB_IO_UTIL_LG       0 %
     BDT     DB_IO_UTIL_SM       0 %
     BDT     DB_IO_WT_LG         0 ms
     BDT     DB_IO_WT_LG_RQ      0.0 ms/request
     BDT     DB_IO_WT_SM         0 ms
     BDT     DB_IO_WT_SM_RQ      0.0 ms/request
As you can see the metric description is not there and there is no way to retrieve it from metriccurrent (or metrichistory) because this is not an attribute:
$ cellcli -e "describe metriccurrent"
    name
    alertState
    collectionTime
    metricObjectName
    metricType
    metricValue
    objectType

$ cellcli -e "describe metrichistory"
    name
    alertState
    collectionTime
    metricObjectName
    metricType
    metricValue
    metricValueAvg
    metricValueMax
    metricValueMin
    objectType
But if you send the result of our example to someone that don’t know (or don’t remember) the naming convention (or if you are not 100% sure of the definition of a particular metric) then he/you’ll have to:
- go back to the oracle documentation
- query the metricdefinition with cellcli
New script: exadata_metrics_desc.pl
Thanks to the exadata_metrics_desc.pl script, you can add (to the cellcli output) the description of the metric on the fly.
Let’s launch the same query (as the one used in the previous example) and add a call to exadata_metrics_desc.pl that way:
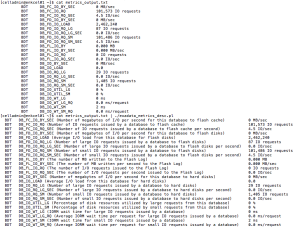
$ cellcli -e "list metriccurrent attributes metricObjectName,name,metricValue where name like 'DB.*' and metricObjectName='BDT'" | ./exadata_metrics_desc.pl

  BDT   DB_FC_IO_BY_SEC (Number of megabytes of I/O per second for this database to flash cache)          0 MB/sec
  BDT   DB_FC_IO_RQ (Number of IO requests issued by a database to flash cache)                           48,123 IO requests
  BDT   DB_FC_IO_RQ_SEC (Number of IO requests issued by a database to flash cache per second)            2.1 IO/sec
  BDT   DB_FD_IO_BY_SEC (Number of megabytes of I/O per second for this database to flash disks)          0 MB/sec
  BDT   DB_FD_IO_LOAD (Average I/O load from this database for flash disks)                               4,419
  BDT   DB_FD_IO_RQ_LG (Number of large IO requests issued by a database to flash disks)                  36 IO requests
  BDT   DB_FD_IO_RQ_LG_SEC (Number of large IO requests issued by a database to flash disks per second)   0.0 IO/sec
  BDT   DB_FD_IO_RQ_SM (Number of small IO requests issued by a database to flash disks)                  48,087 IO requests
  BDT   DB_FD_IO_RQ_SM_SEC (Number of small IO requests issued by a database to flash disks per second)   2.1 IO/sec
  BDT   DB_FL_IO_BY (The number of MB written to the Flash Log)                                           0.000 MB
  BDT   DB_FL_IO_BY_SEC (The number of MB written per second to the Flash Log)                            0.000 MB/sec
  BDT   DB_FL_IO_RQ (The number of I/O requests issued to the Flash Log)                                  0 IO requests
  BDT   DB_FL_IO_RQ_SEC (The number of I/O requests per second issued to the Flash Log)                   0.0 IO/sec
  BDT   DB_IO_BY_SEC (Number of megabytes of I/O per second for this database to hard disks)              0 MB/sec
  BDT   DB_IO_LOAD (Average I/O load from this database for hard disks)                                   0.0
  BDT   DB_IO_RQ_LG (Number of large IO requests issued by a database to hard disks)                      0 IO requests
  BDT   DB_IO_RQ_LG_SEC (Number of large IO requests issued by a database to hard disks per second)       0.0 IO/sec
  BDT   DB_IO_RQ_SM (Number of small IO requests issued by a database to hard disks)                      19 IO requests
  BDT   DB_IO_RQ_SM_SEC (Number of small IO requests issued by a database to hard disks per second)       0.0 IO/sec
  BDT   DB_IO_UTIL_LG (Percentage of disk resources utilized by large requests from this database)        0 %
  BDT   DB_IO_UTIL_SM (Percentage of disk resources utilized by small requests from this database)        0 %
  BDT   DB_IO_WT_LG (IORM wait time for large IO requests issued by a database)                           0 ms
  BDT   DB_IO_WT_LG_RQ (Average IORM wait time per request for large IO requests issued by a database)    0.0 ms/request
  BDT   DB_IO_WT_SM (IORM wait time for small IO requests issued by a database)                           0 ms
  BDT   DB_IO_WT_SM_RQ (Average IORM wait time per request for small IO requests issued by a database)    0.0 ms/request
As you can see the description of each metric being part of the initial output has been added.
Remarks
- You can download the script from this repository or from GitHub.
- Feel free to build the query you want on the metrics. You just need to add a call to exadata_metrics_desc.pl to see the metric description being added on the fly (as long as the metric name appears in the output of your initial query).
- The idea of this script is all to credit to Martin Bach.
- This script works with any input (could be a text file):
Conclusion
The exadata_metrics_desc.pl can be used to join on the fly the metric name, its value (and whatever attribute you would love to see) with its associated description.