Some days ago I wrote about a side effect of Flex ASM 12c (12.1) that I called “unpreferred read”. While I was writing this post I thought that the side effect demonstration will be even more clear if my asmiostat utility could display database Instances as well.
This is done with my asmiostat utility V2 which provides those new features:
- Ability to display database instances (as of 11gr1).
- Ability to sort based on the number of reads.
- Ability to sort based on the number of writes.
The following metrics are still collected:
- Reads/s: Number of read per second.
- KbyRead/s: Kbytes read per second.
- Avg ms/Read: ms per read in average.
- AvgBy/Read: Average Bytes per read.
- Same metrics are provided for Write Operations.
Of course the old features remain (see this post for more details about the previous features):
- Ability to display/aggregate/filter following your needs on ASM instances, diskgroup, failgroup and disks (And now on database instances as well).
- Ability to display Exadata Cells IPs instead of ASM Failgroup.
Let’s have a look to 2 examples using the V2 features:
First one: I want to know which database Instance is generating most of the Read IO requests per ASM instance, and I also want to see the performance metrics.
Fine, let’s launch my utility that way:
./real_time.pl -type=asmiostat -show=inst,dbinst -sort_field=reads
With the following output:
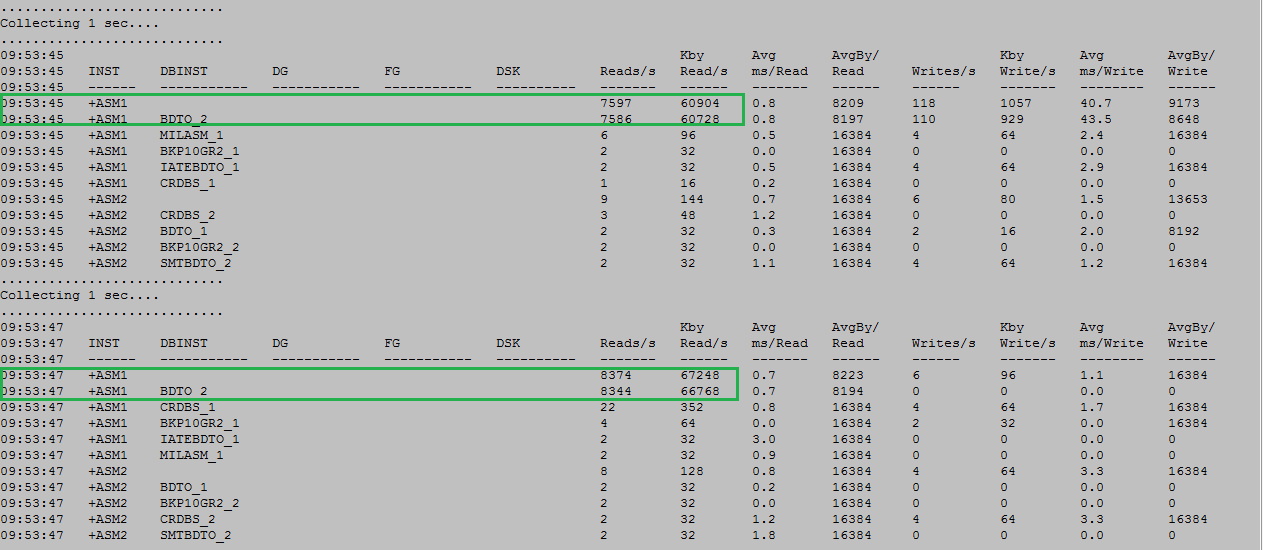
As you can see the BDTO_2 database instance is generating the most part of the read IO request using +ASM1.
Second one: I want to see Flex ASM 12c (12.1) “unpreferred” read in action.
Well, I am using the same setup as the one described into the “unpreferred read” post.
I launch Kevin Closson’s SLOB2 Kit to generate Physical IO locally on the NOPBDT3 database instance. I check the behavior with my asmiostat utility that way:
./real_time.pl -type=asmiostat -show=inst,dbinst,dg,fg -dg=DATAP -dbinst='%NOP%'
With the following output:
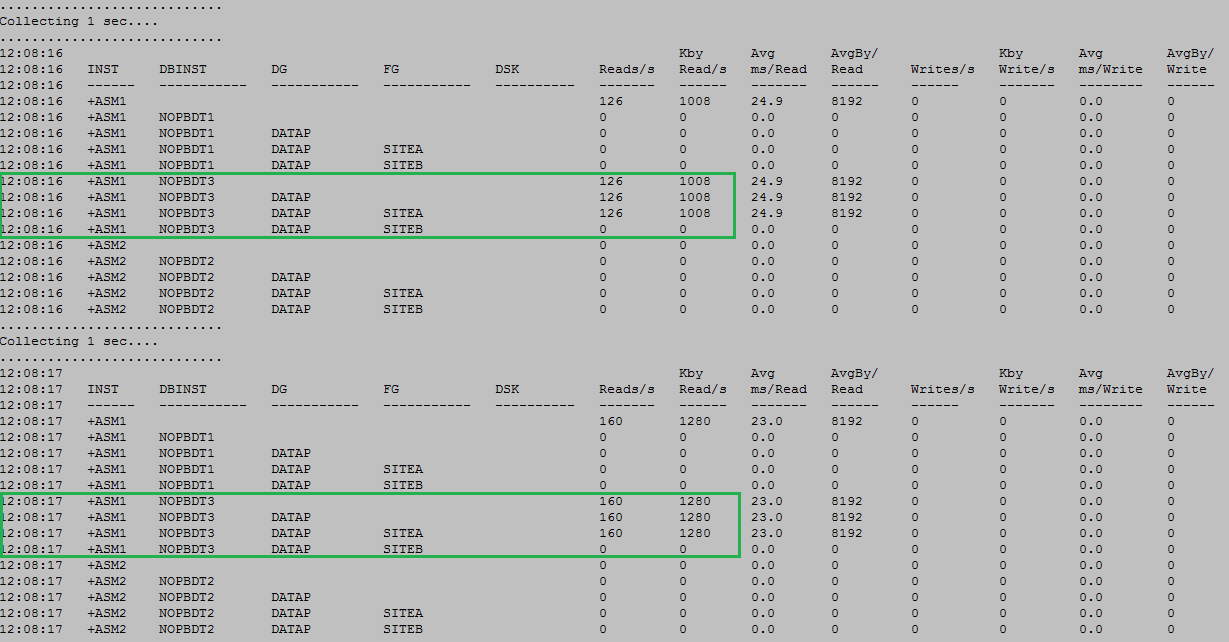
As you can see the NOPBDT3 database instance (located in SITEB) is using the ASM1 instance which prefers to read from SITEA. Then the NOPBDT3 database instance is reading from SITEA which is bad.
Remarks and conclusion:
- My asmiostat utility V2 is helpful to see which database instance is using which ASM instance (and also collect the performance metrics).
- This will be very useful with Flex ASM in place but it can also be used with non Flex ASM (See the first example).
- You can download my asmiostat utility (which is part of the real_time.pl script) from this repository.
- The utility V2 still works with 10gr2 ASM but the “Database instance” feature is triggered as of 11gr1 (as it is based on the gv$asm_disk_iostat view).
- I did not had the chance to play with pluggable databases yet: This will be the next step around my utility.
- If you hit this issue:
./real_time.pl
: No such file or directory
- Then launch it that way:
perl ./real_time.pl
UPDATE: The asmiostat utility is not part of the real_time.pl script anymore. A new utility called asm_metrics.pl has been created. See “ASM metrics are a gold mine. Welcome to asm_metrics.pl, a new utility to extract and to manipulate them in real time” for more information.