Introduction
Suppose that I am trying to consolidate multiple databases on to a single server and that I would like to limit the cpu usage of one of the database. Then I decide to test the cpu binding approach and the Instance caging approach.
You can find a great description and how to implement:
- cpu binding using the processor_group_name database 12c parameter into Nikolay Manchev’s post.
- Instance caging into Tim Hall’s post.
During those tests I would like to compare the cpu binding and the Instance caging performance during Logical IO pressure (By pressure I mean that the database would need more cpu resources than the ones it is limited to use).
Tests setup
The tests will be performed on a single machine and this NUMA configuration:
Architecture:          x86_64
CPU op-mode(s):        32-bit, 64-bit
Byte Order:            Little Endian
CPU(s):                160
On-line CPU(s) list:   0-159
Thread(s) per core:    2
Core(s) per socket:    10
Socket(s):             8
NUMA node(s):          8
Vendor ID:             GenuineIntel
CPU family:            6
Model:                 47
Stepping:              2
CPU MHz:               1995.926
BogoMIPS:              3991.60
Virtualization:        VT-x
L1d cache:             32K
L1i cache:             32K
L2 cache:              256K
L3 cache:              24576K
NUMA node0 CPU(s):     1-10,41-50
NUMA node1 CPU(s):     11-20,51-60
NUMA node2 CPU(s):     21-30,61-70
NUMA node3 CPU(s):     31-40,71-80
NUMA node4 CPU(s):     0,81-89,120-129
NUMA node5 CPU(s):     90-99,130-139
NUMA node6 CPU(s):     100-109,140-149
NUMA node7 CPU(s):     110-119,150-159
and this cpu topology (the script comes from Karl Arao’s cputoolkit here):
> sh ./cpu_topology
model name      : Intel(R) Xeon(R) CPU E7- 4850  @ 2.00GHz
processors  (OS CPU count)          0 1 2 3 4 5 6 7 8 9 10 11 12 13 14 15 16 17 18 19 20 21 22 23 24 25 26 27 28 29 30 31 32 33 34 35 36 37 38 39 40 41 42 43 44 45 46 47 48 49 50 51 52 53 54 55 56 57 58 59 60 61 62 63 64 65 66 67 68 69 70 71 72 73 74 75 76 77 78 79 80 81 82 83 84 85 86 87 88 89 90 91 92 93 94 95 96 97 98 99 100 101 102 103 104 105 106 107 108 109 110 111 112 113 114 115 116 117 118 119 120 121 122 123 124 125 126 127 128 129 130 131 132 133 134 135 136 137 138 139 140 141 142 143 144 145 146 147 148 149 150 151 152 153 154 155 156 157 158 159
physical id (processor socket)      0 4 4 4 4 4 4 4 4 4 4 5 5 5 5 5 5 5 5 5 5 6 6 6 6 6 6 6 6 6 6 7 7 7 7 7 7 7 7 7 7 4 4 4 4 4 4 4 4 4 4 5 5 5 5 5 5 5 5 5 5 6 6 6 6 6 6 6 6 6 6 7 7 7 7 7 7 7 7 7 7 0 0 0 0 0 0 0 0 0 1 1 1 1 1 1 1 1 1 1 2 2 2 2 2 2 2 2 2 2 3 3 3 3 3 3 3 3 3 3 0 0 0 0 0 0 0 0 0 0 1 1 1 1 1 1 1 1 1 1 2 2 2 2 2 2 2 2 2 2 3 3 3 3 3 3 3 3 3 3
siblings    (logical CPUs/socket)   20 20 20 20 20 20 20 20 20 20 20 20 20 20 20 20 20 20 20 20 20 20 20 20 20 20 20 20 20 20 20 20 20 20 20 20 20 20 20 20 20 20 20 20 20 20 20 20 20 20 20 20 20 20 20 20 20 20 20 20 20 20 20 20 20 20 20 20 20 20 20 20 20 20 20 20 20 20 20 20 20 20 20 20 20 20 20 20 20 20 20 20 20 20 20 20 20 20 20 20 20 20 20 20 20 20 20 20 20 20 20 20 20 20 20 20 20 20 20 20 20 20 20 20 20 20 20 20 20 20 20 20 20 20 20 20 20 20 20 20 20 20 20 20 20 20 20 20 20 20 20 20 20 20 20 20 20 20 20 20
core id     (# assigned to a core)  0 0 1 2 8 9 16 17 18 24 25 0 1 2 8 9 16 17 18 24 25 0 1 2 8 9 16 17 18 24 25 0 1 2 8 9 16 17 18 24 25 0 1 2 8 9 16 17 18 24 25 0 1 2 8 9 16 17 18 24 25 0 1 2 8 9 16 17 18 24 25 0 1 2 8 9 16 17 18 24 25 1 2 8 9 16 17 18 24 25 0 1 2 8 9 16 17 18 24 25 0 1 2 8 9 16 17 18 24 25 0 1 2 8 9 16 17 18 24 25 0 1 2 8 9 16 17 18 24 25 0 1 2 8 9 16 17 18 24 25 0 1 2 8 9 16 17 18 24 25 0 1 2 8 9 16 17 18 24 25
cpu cores   (physical cores/socket) 10 10 10 10 10 10 10 10 10 10 10 10 10 10 10 10 10 10 10 10 10 10 10 10 10 10 10 10 10 10 10 10 10 10 10 10 10 10 10 10 10 10 10 10 10 10 10 10 10 10 10 10 10 10 10 10 10 10 10 10 10 10 10 10 10 10 10 10 10 10 10 10 10 10 10 10 10 10 10 10 10 10 10 10 10 10 10 10 10 10 10 10 10 10 10 10 10 10 10 10 10 10 10 10 10 10 10 10 10 10 10 10 10 10 10 10 10 10 10 10 10 10 10 10 10 10 10 10 10 10 10 10 10 10 10 10 10 10 10 10 10 10 10 10 10 10 10 10 10 10 10 10 10 10 10 10 10 10 10 10
For the tests I’ll use SLOB and apply some parameters at the instance level for Logical IO testing:
> cat lio_init.sql
alter system reset "_db_block_prefetch_limit" scope=spfile sid='*';
alter system reset "_db_block_prefetch_quota"  scope=spfile sid='*';
alter system reset "_db_file_noncontig_mblock_read_count" scope=spfile sid='*';
alter system reset "cpu_count" scope=spfile sid='*';
alter system set "db_cache_size"=20g scope=spfile sid='*';
alter system set "shared_pool_size"=10g scope=spfile sid='*';
alter system set "sga_target"=0 scope=spfile sid='*';
I also have to say that the _enable_NUMA_support parameter has been kept to its default value: FALSE.
Then, for accurate comparison, each test will be based on the same SLOB configuration and workload: 9 readers and fix run time of 5 minutes. I’ll run SLOB 3 times per test and then I’ll compare how many logical reads have been done on average per test for all the 3 runs.
**TEST 1: Just out of curiosity, launch the SLOB runs without cpu binding and without Instance caging (without LIO pressure)
**
With 9 readers, the average result is the following:
Load Profile                    Per Second   Per Transaction  Per Exec  Per Call
~~~~~~~~~~~~~~~            ---------------   --------------- --------- ---------
             DB Time(s):               8.9              58.8      0.00      3.66
              DB CPU(s):               8.9              58.7      0.00      3.65
  Logical read (blocks):       6,323,758.9      41,668,897.2


Top 10 Foreground Events by Total Wait Time
~~~~~~~~~~~~~~~~~~~~~~~~~~~~~~~~~~~~~~~~~~~
                                           Total Wait       Wait   % DB Wait
Event                                Waits Time (sec)    Avg(ms)   time Class
------------------------------ ----------- ---------- ---------- ------ --------
DB CPU                                         2700.6              99.8
As you can see during those 5 minutes run time, SLOB generated about 6 300 000 logical reads per second. Those are also Full cached SLOB runs as the top event is “DB CPU” for about 100% of the DB time.
TEST 2: Instance caging in place and LIO pressure
As I am using 9 SLOB readers, I’ll set the cpu_count parameter to 6 (to produce LIO pressure).
SQL> alter system set cpu_count=6;

System altered.

SQL> alter system set resource_manager_plan='default_plan';

System altered.
The average result is the following:
Load Profile                    Per Second   Per Transaction  Per Exec  Per Call
~~~~~~~~~~~~~~~            ---------------   --------------- --------- ---------
             DB Time(s):               8.9              64.4      0.00      3.86
              DB CPU(s):               5.4              39.0      0.00      2.34
  Logical read (blocks):       3,495,618.2      25,222,299.9


Top 10 Foreground Events by Total Wait Time
~~~~~~~~~~~~~~~~~~~~~~~~~~~~~~~~~~~~~~~~~~~
                                           Total Wait       Wait   % DB Wait
Event                                Waits Time (sec)    Avg(ms)   time Class
------------------------------ ----------- ---------- ---------- ------ --------
DB CPU                                         1638.6              60.6
resmgr:cpu quantum                  16,005     1065.4      66.57   39.4 Schedule
As you can see during those 5 minutes run time, SLOB generated about 3 500 000 logical reads per second. Those are also Full cached SLOB runs as the top events are “DB CPU” and “resmgr:cpu quantum” (that is linked to the Instance caging) for about 100% of the DB time.
TEST 3: cpu binding in place and LIO pressure
As I am using 9 SLOB readers, I’ll set 6 cpus in the “oracle” cgroup (to compare with the previous test and to produce LIO pressure) that way:
   cpuset {
     cpuset.mems="0";
     cpuset.cpus="1-6";
   }
remove caging and set processor_group_name to “oracle”:
SQL> alter system reset cpu_count scope=spfile sid='*';

System altered.

SQL> alter system reset resource_manager_plan scope=spfile sid='*';

System altered.

SQL> alter system set processor_group_name='oracle' scope=spfile sid='*';

System altered.
The average result is the following:
Load Profile                    Per Second   Per Transaction  Per Exec  Per Call
~~~~~~~~~~~~~~~            ---------------   --------------- --------- ---------
             DB Time(s):               8.9              64.4      0.00      3.70
              DB CPU(s):               5.9              42.3      0.00      2.43
  Logical read (blocks):       5,786,023.5      41,714,611.9


Top 10 Foreground Events by Total Wait Time
~~~~~~~~~~~~~~~~~~~~~~~~~~~~~~~~~~~~~~~~~~~
                                           Total Wait       Wait   % DB Wait
Event                                Waits Time (sec)    Avg(ms)   time Class
------------------------------ ----------- ---------- ---------- ------ --------
DB CPU                                         1775.1              65.6
db file sequential read                578        1.5       2.64     .1 User I/O
latch free                             213          1       4.80     .0 Other
.
.
.
As you can see during those 5 minutes run time:
- SLOB generated about 5 800 000 logical reads per second.
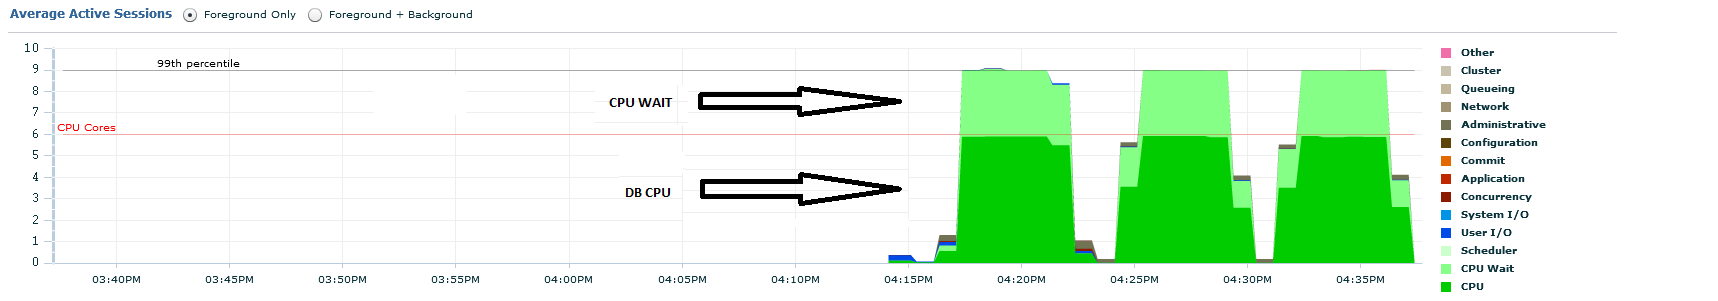
- The sum of the “% DB WAIT time” are less than 100% (“DB CPU” represents 65.6% of it).
This last observation is due to the fact that “CPU WAIT” is not included into “DB CPU”. OEM gives a clear picture of it:
Remarks:
- You can find more details about “DB CPU” and “CPU WAIT” into this Doug Burns’s post.
- Kyle Hailey provided a sql to measure the “DB CPU” and “CPU WAIT” into this blog post.
That said, I can conclude that about 100% of the DB Time has been spent into the CPU or the run queue: Then those are also Full cached SLOB runs.
BUT WAIT: The previous test (cpu binding) has an advantage compare to the Instance caging one: The SGA and the cpus have been allocated from the same NUMA node (See the beginning of this post), while the SGA is spread across NUMA nodes in the Instance caging test. And it matters: See this post for more details.
Then I need to setup a new test: Create a cgroup with 9 cpus on the same NUMA node as the SGA, set the caging to 6 and start the instance on this cgroup.
That way, I’ll be able to compare Apple and Apple, means compare:
- TEST 3: cpu binding in place and LIO pressure
- TEST 4: cpu binding and Instance caging in place with LIO pressure due to the caging
Let’s do it:
TEST 4: cpu binding and Instance caging in place with LIO pressure due to the caging
As I am using 9 SLOB readers, I’ll set 9 cpus in the “oracle” cgroup, put the caging to 6 (to compare with the previous test and to produce LIO pressure) that way:
SQL> alter system set cpu_count=6 ;

System altered.

SQL> alter system set resource_manager_plan='default_plan';

System altered.

SQL> alter system set processor_group_name='oracle' scope=spfile sid='*';

System altered.
with the “oracle” cgroup setup that way (cpus and SGA allocated on the same NUMA node):
   cpuset {
     cpuset.mems="0";
     cpuset.cpus="1-9";
   }
The average result is the following:
Load Profile                    Per Second   Per Transaction  Per Exec  Per Call
~~~~~~~~~~~~~~~            ---------------   --------------- --------- ---------
             DB Time(s):               8.9              58.8      0.00      3.81
              DB CPU(s):               5.4              35.4      0.00      2.29
  Logical read (blocks):       5,182,622.4      34,126,892.6


Top 10 Foreground Events by Total Wait Time
~~~~~~~~~~~~~~~~~~~~~~~~~~~~~~~~~~~~~~~~~~~
                                           Total Wait       Wait   % DB Wait
Event                                Waits Time (sec)    Avg(ms)   time Class
------------------------------ ----------- ---------- ---------- ------ --------
DB CPU                                         1627.8              60.2
resmgr:cpu quantum                  16,190     1064.9      65.78   39.4 Schedule
As you can see during those 5 minutes run time, SLOB generated about 5 100 000 logical reads per second. Those are also Full cached SLOB runs as the top events are “DB CPU” and “resmgr:cpu quantum” (that is linked to the Instance caging) for about 100% of the DB time.
Last test, just out of curiosity to compare with TEST 1:
**TEST 5: Just out of curiosity, launch the SLOB runs with cpu binding and without Instance caging (without LIO pressure)
**
As I am using 9 SLOB readers, I’ll set 9 cpus in the “oracle” cgroup without caging (to compare with the test 1 and not to produce LIO pressure).
The average result is the following:
Load Profile                    Per Second   Per Transaction  Per Exec  Per Call
~~~~~~~~~~~~~~~            ---------------   --------------- --------- ---------
             DB Time(s):               9.0              64.5      0.00      2.79
              DB CPU(s):               8.8              63.8      0.00      2.75
  Logical read (blocks):       8,623,444.6      62,178,526.0


Top 10 Foreground Events by Total Wait Time
~~~~~~~~~~~~~~~~~~~~~~~~~~~~~~~~~~~~~~~~~~~
                                           Total Wait       Wait   % DB Wait
Event                                Waits Time (sec)    Avg(ms)   time Class
------------------------------ ----------- ---------- ---------- ------ --------
DB CPU                                         2677.3              98.8
As you can see during those 5 minutes run time, SLOB generated about 8 600 000 logical reads per second. Those are also Full cached SLOB runs as the top event is “DB CPU” with about 100% of the DB time.
Conclusion:
The ranking is the following (Logical IO per seconds in descending order):
- cpu binding (without LIO pressure): 8 600 000 logical reads per second.
- without anything (without LIO pressure): 6 300 000 logical reads per second.
- cpu binding only and LIO pressure: 5 800 000 logical reads per second.
- cpu binding and Instance caging (LIO pressure due to the caging): 5 100 000 logical reads per second.**
** - Instance caging only and LIO pressure: 3 500 000 logical reads per second.
Only ranks 3, 4 and 5 are of interest regarding the initial goal of this post. And only 3 and 4 are valuable comparison.
So, comparing 3 and 4 ranks, I can conclude that the Instance caging has been less performant (compare to the cpu binding) by about 10% during LIO pressure (by pressure I mean that the database needs more cpu resources than the ones it is limited to use). It makes sense to me as the caging is managed by the oracle database software and then needs some overhead.
Now that I have compared cpu binding and Instance caging from a performance point of view, I’ll discuss pros and cons of both approach into another blog post.
Useful link related to the oracle database and CPU interaction:
- Where did my cpu go presentation from Karl Arao.