This article is the first Part of the “A closer look at ASM rebalance” series:
- Part I: Disks have been added.
- Part II: Disks have been dropped.
- Part III: Disks have been added and dropped (at the same time).
If you are not familiar with ASM rebalance I would suggest first to read those 2 blog posts written by Bane Radulovic:
In this part I want to visualize the rebalance operation (with 3 power values: 2,6 and 11) after disks have been added (no dropped disks yet: It will be for the parts II and III).
To do so, on a 2 nodes Extended Rac Cluster (11.2.0.4), I added 2 disks into the DATA diskgroup (created with an ASM Allocation Unit of 4MB) and launched (connected on +ASM1):
- alter diskgroup DATA rebalance power 2; (At 11:55 AM).
- alter diskgroup DATA rebalance power 6; (At 12:05 PM).
- alter diskgroup DATA rebalance power 11; (At 12:15 PM).
And then I waited until it finished (means v$asm_operation returns no rows for the DATA diskgroup).
Note that 2) and 3) interrupted the rebalance in progress and launched a new one with a new power.
During this amount of time I collected the ASM performance metrics that way for the DATA diskgroup only.
I’ll present the results with Tableau (For each Graph I’ll keep the “columns”, “rows” and “marks” shelf into the print screen so that you can reproduce).
Note: There is no database activity on the Host where the rebalance has been launched.
Here are the results:
First let’s verify that the whole rebalance activity has been done on the +ASM1 instance (As I launched the rebalance operations from it).
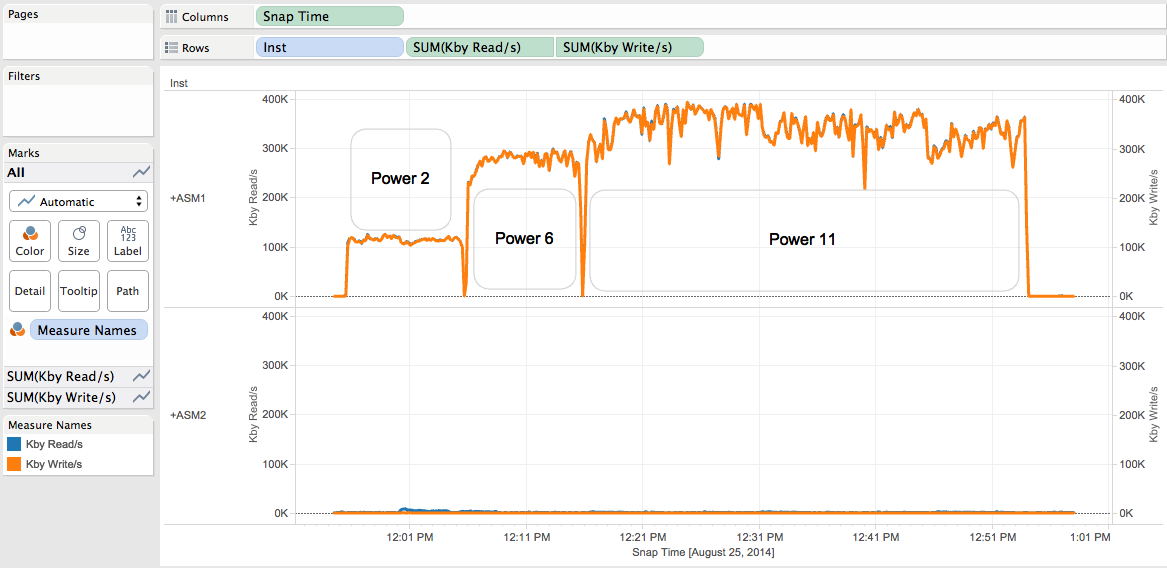
We can see:
- That all Read and Write rebalance activity has been done on +ASM1 .
- That the read throughput is very close to the write throughput on +ASM1.
- The impact of the power values (2,6 and 11) on the throughput.
Now I would like to compare the behavior of 2 Sets of Disks: The disks added and the disks that are already part of the DATA diskgroup.
To do so, let’s create in Tableau a SET that contains the 2 new disks.
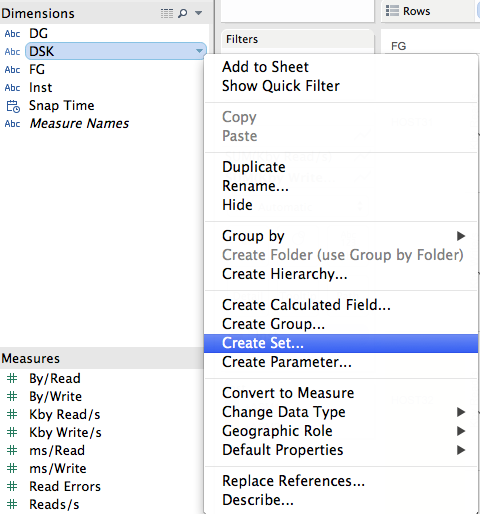
Let’s call it “New Disks”
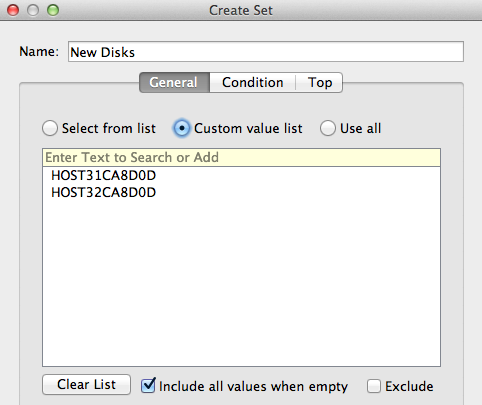
So that now we are able to display the ASM metrics IN this set (the 2 new disks) and OUT this set (the already existing disks means already part of the DATA diskgroup).
I will filter the metrics on ASM1 only (to avoid any “little parasites” coming from ASM2).
Let’s visualize the Reads/s and Writes/s metrics:
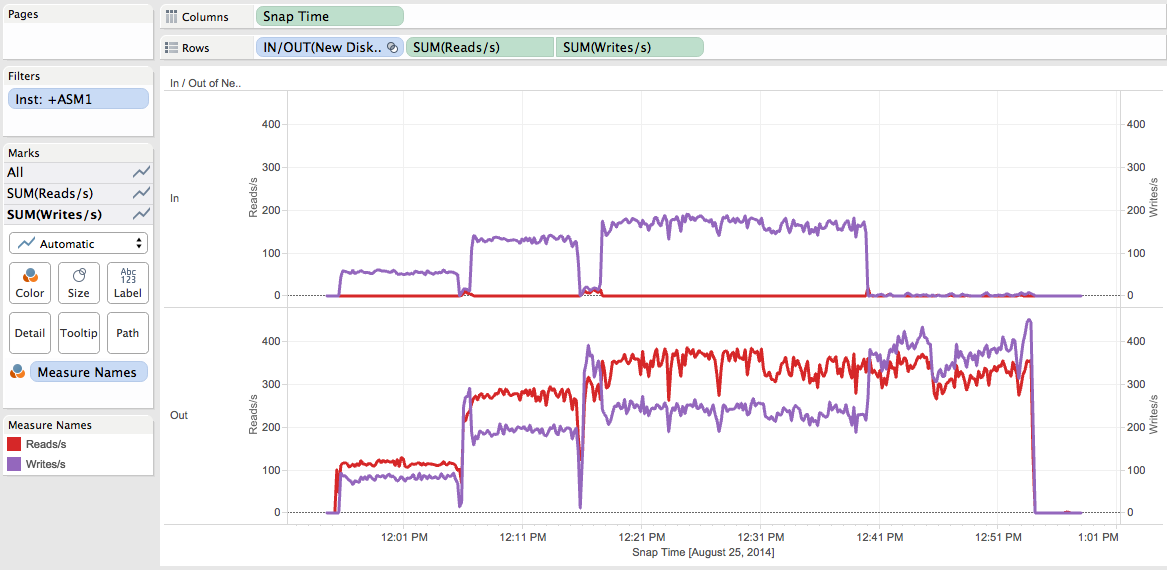
We can see that during the 3 rebalances:
- No Reads on the new disks (at least until about 12:40 pm).
- Number of Writes/s increasing on the new disks depending of the power values.
- Reads/s and Writes/s both increasing on the already existing disks depending of the power values.
- As of 12.40 pm, activity on the existing disks while near zero activity on the new ones.
- As of 12.40 pm number of Writes/s >= Reads/s** on the existing disks (while it was the opposite before).
- Are 1, 2 and 3 surprising? No.
- What happened for 4 and 5? I’ll answer later on.
Let’s visualize the Kby Read/s and Kby Write/s metrics:
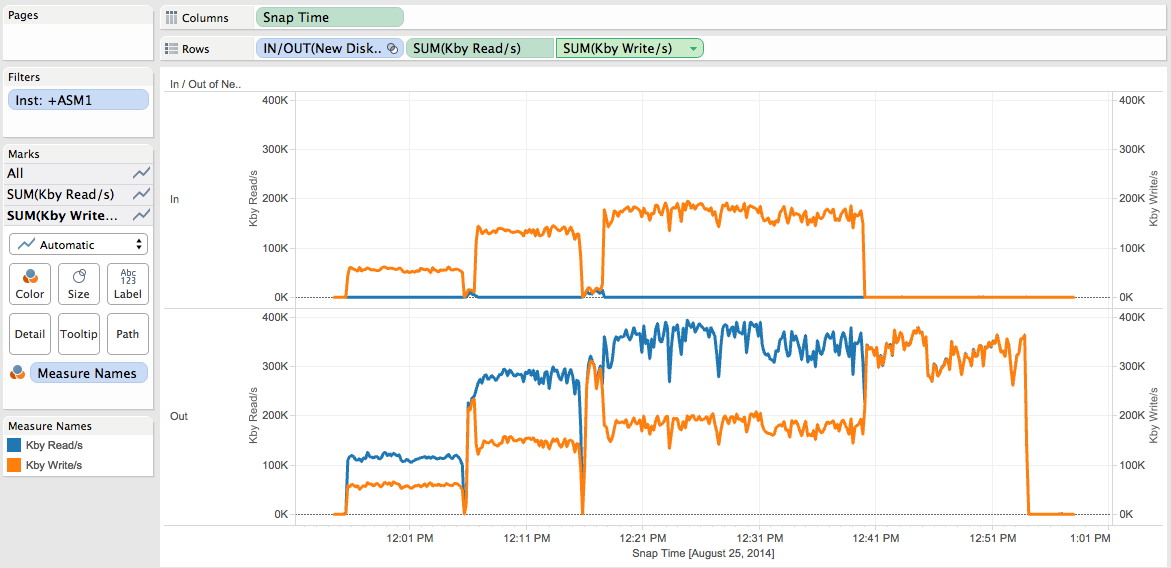
We can see that during the 3 rebalances:
- No Kby Read/s on the new disks.
- Number of Kby Write/s increasing on the new disks depending of the power values.
- Kby Read/s and Kby Write/s both increasing on the existing disks depending of the power values.
- As of 12.40 pm, activity on the existing disks while no activity on the new ones.
- As of 12.40 pm same amount of Kby Read/s and Kby Write/s on the existing disks (while it was not the case before).
- Are 1, 2 and 3 surprising? No.
- What happened for 4 and 5? I’ll answer later on.
Let’s visualize the Average By/Read and Average By/Write metrics:
Important remark regarding the averages computation/display: The By/Read and By/Write measures depend on the number of reads. So the averages have to be calculated using Weighted Averages.
Let’s create the calculated field in Tableau for the By/Read Weighted Average:
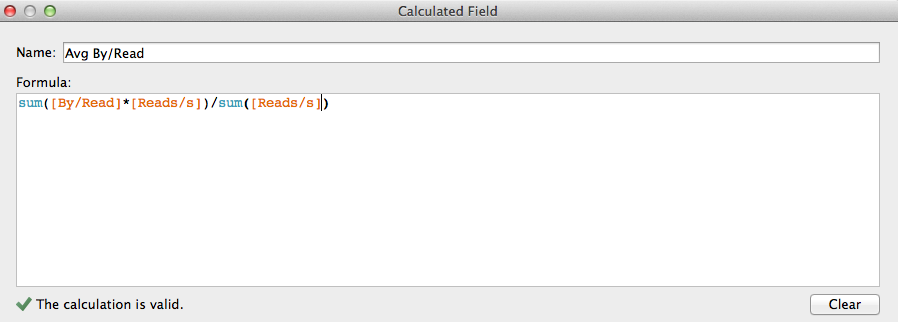
The same has to be done for the By/Write Weighted Average.
Let’s see the result:
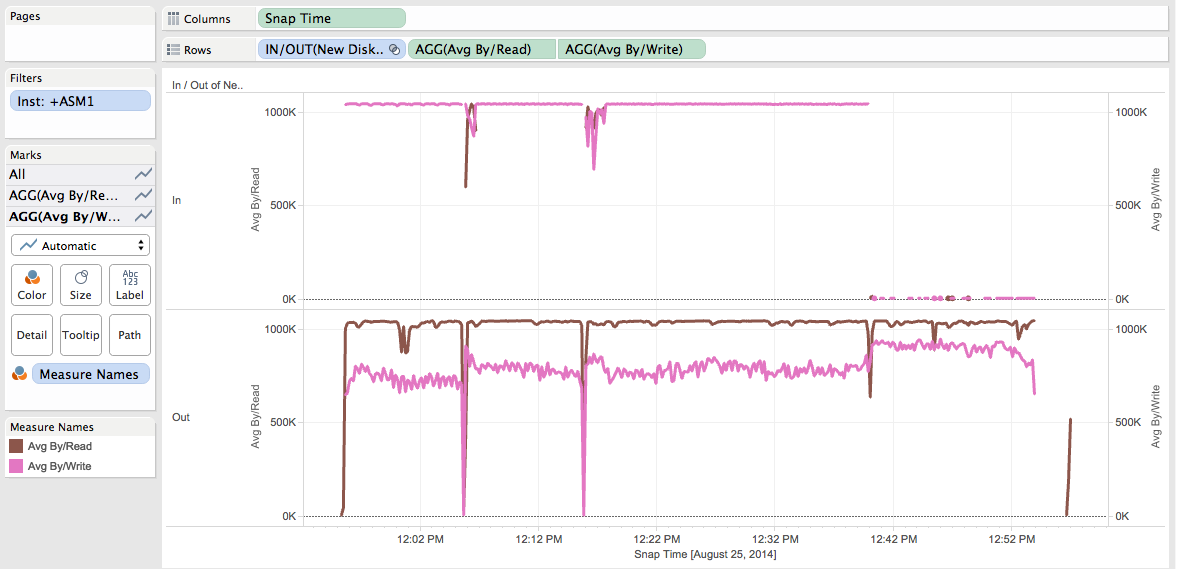
We can see:
- The Avg By/Write on the new disks is about the same (about 1MB) whatever the power value is (before 12:40 pm).
- The Avg By/Write tends to increase with the power on the already existing disks.
- The Avg By/Read on the existing disks is about the same (about 1MB) whatever the power value is.
- Is 1 surprising? No.
- Is 2 surprising? Yes (at least for me).
- Is 3 surprising? No.
Now that we have seen all those metrics, we can ask:
Q1: So what the hell happened at 12:40 pm?
Let’s check the alert_+ASM1.log file at that time:
Mon Aug 25 12:15:44 2014
ARB0 started with pid=33, OS id=1187132
NOTE: assigning ARB0 to group 4/0x1e089b59 (DATA) with 11 parallel I/Os
Mon Aug 25 12:15:47 2014
NOTE: Attempting voting file refresh on diskgroup DATA
NOTE: Refresh completed on diskgroup DATA. No voting file found.
cellip.ora not found.
Mon Aug 25 12:39:52 2014
NOTE: GroupBlock outside rolling migration privileged region
NOTE: requesting all-instance membership refresh for group=4
Mon Aug 25 12:40:03 2014
GMON updating for reconfiguration, group 4 at 372 for pid 35, osid 1225810
NOTE: group DATA: updated PST location: disk 0014 (PST copy 0)
NOTE: group DATA: updated PST location: disk 0015 (PST copy 1)
Mon Aug 25 12:40:03 2014
NOTE: group 4 PST updated.
Mon Aug 25 12:40:03 2014
NOTE: membership refresh pending for group 4/0x1e089b59 (DATA)
GMON querying group 4 at 373 for pid 18, osid 67864
SUCCESS: refreshed membership for 4/0x1e089b59 (DATA)
NOTE: Attempting voting file refresh on diskgroup DATA
NOTE: Refresh completed on diskgroup DATA. No voting file found.
Mon Aug 25 12:45:24 2014
NOTE: F1X0 copy 2 relocating from 18:44668 to 18:20099 for diskgroup 4 (DATA)
Mon Aug 25 12:53:49 2014
NOTE: stopping process ARB0
SUCCESS: rebalance completed for group 4/0x1e089b59 (DATA)
We can see that the ASM rebalance started the compacting phase (See Bane Radulovic’s blog post for more details about the ASM rebalances phases).
Q2: The ASM Allocation Unit size is 4MB and the Avg By/Read is stucked to 1MB,why?
I guess this is somehow related to the max_sectors_kb and max_hw_sectors_kb SYSFS parameters. It will be the subject of another post.
Two remarks before to conclude:
- The ASM rebalance activity is not recorded into the v$asm_disk_iostat view. It is recorded into the v$asm_disk_stat view. So, if you are using the asm_metrics utility, you have to change the asm_feature_version variable to a value > your ASM instance version.
- I tested with compatible.asm set to 10.1 and 11.2.0.2 and observed the same behavior for all those metrics.
Conclusion of Part I:
- We visualized that the compacting phase of the rebalance operation generates much more activity on the existing disks compare to near zero activity on the new disks.
- We visualized that the compacting phase of the rebalance operation generates the same amount of Kby Read/s and Kby Write/s on the existing disks (while it was not the case before).
- We visualized that during the compacting phase the number of Writes/s >= Reads/s** on the existing disks (while it was the opposite before).
- We visualized that the Avg By/Read does not exceed 1MB on the existing disks (while the ASM allocation Unit has been set to 4MB on my diskgroup).
- We visualized that the Avg By/Write tends to increase with the power on the already existing disks (quite surprising to me).
- I’ll update this post with ASM 12c results as soon as I can (if something new needs to be told).