A quick post to let you know that I just finished a R script to monitor the database activity in real time.
The “graph_real_time_db_activity.r” script (You can download it from this repository) basically takes a snapshot based on the v$system_event view then computes and graphs the differences with the previous snapshot.
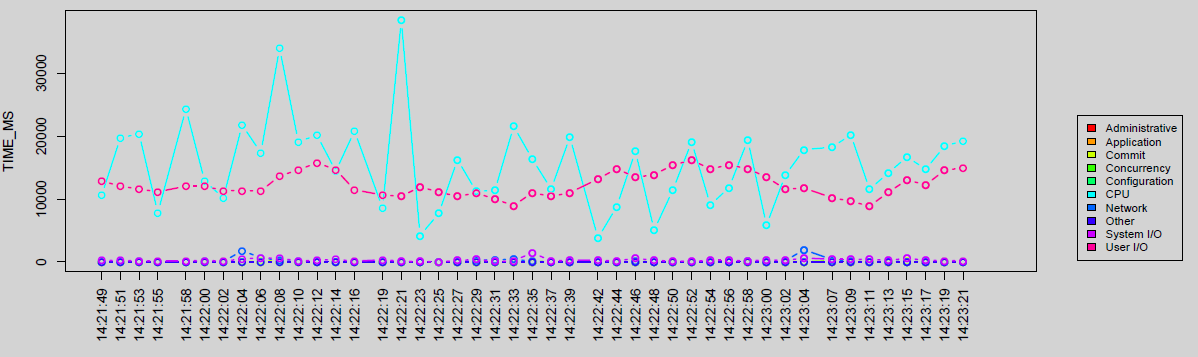
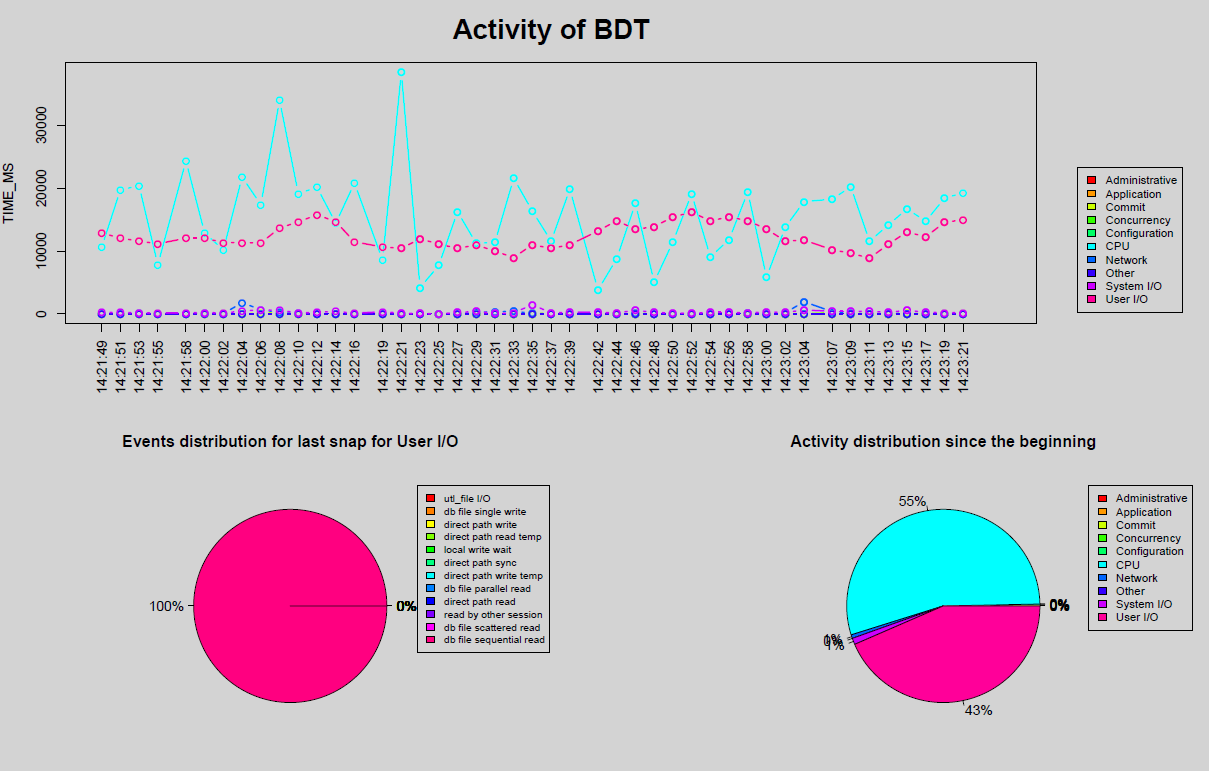
One graph refreshed in real time is provided. It contains:
- A sub-graph for the time waited (in ms) per wait class.
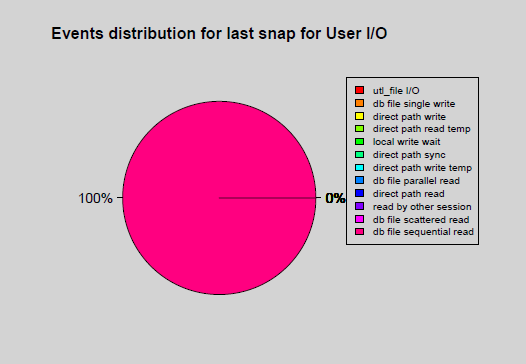
- A sub-graph for the wait events distribution of the wait class having the max time waited during the last snap.
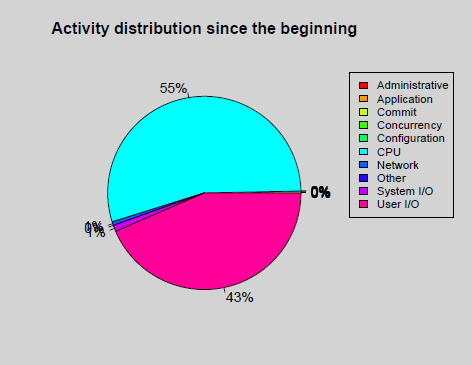
- A sub-graph for the wait class distribution since the script has been launched.
The script also provides:
- a text file that contains the snaps computations.
- a pdf file that contains the final graph.
As you can see, for a better understanding of the database behavior, I also included a fake “CPU” wait class (coming from the v$sys_time_model view) as suggested by Guy Harrison into this blog post.
The graph is generated to both outputs (X11 and the pdf file). In case the X11 environment does not work, the pdf file is generated anyway.
Let’s see the script in action:
./graph_real_time_db_activity.r
Building the thin jdbc connection string....

host ?:BDT_HOST
port ?:1521
service_name ?: BDT
system password ?:donotreadthis
Number of snapshots:50
Refresh interval (seconds):2
Loading required package: methods
Loading required package: DBI
Loading required package: rJava
Please enter any key to exit:
As you can see you are prompted for:
- jdbc thin “like” details to connect to the database (You can launch the R script outside the host hosting the database).
- oracle system user password.
- Number of snapshots.
- Refresh Interval.
So you can choose the number of snapshots and the graph refresh interval.
The output is like:
Remarks:
- The script does not create any objects into the database.
- If you want to install R, a good staring point is into the “Getting Staring” section of this link.
- Now that I am able to graph in real time with R, my next work is to graph in real time the metrics coming from my asmiostat utility. I’ll keep you posted.