In one of my previous post I provided a R script to retrieve and visualize wait events metrics from AWR. Now with this post I will provide a R script to retrieve and visualize the same metrics in real time.
For that purpose I created a R script “graph_real_time_event.r” (You can download it from this repository) that provides:
- A graph for the TIME_WAITED_MS metric refreshed in real time.
- A graph for the NB_WAITS metric refreshed in real time.
- A graph for the MS_PER_WAIT metric refreshed in real time.
- A graph for the Histogram of MS_PER_WAIT refreshed in real time.
- A pdf file that contains those graphs.
- A text file that contains the output of the query used to build the graphs.
Basically the script takes a snapshot based on the v$system_event view then computes and graphs the differences with the previous snapshot.
The graph is generated to both outputs (X11 and the pdf file). In case the X11 environment does not work, the pdf file is generated anyway. In that particular case the pdf file contains a page per snapshot.
Let’s see the script in action:
./graph_real_time_event.r
Building the thin jdbc connection string....

host ?: bdt_host
port ?: 1521
service_name ?: BDT
system password ?: donotreadthis
Display which system event (no quotation marks) ?: db file sequential read
Number of snapshots: 60
Refresh interval (seconds): 2
Loading required package: methods
Loading required package: DBI
Loading required package: rJava
Please enter any key to exit:
As you can see you are prompted for:
- jdbc thin “like” details to connect to the database (You can launch the R script outside the host hosting the database).
- oracle system user password.
- The wait event we want to focus on.
- Number of snapshots.
- Refresh Interval.
So you can choose the number of snapshots and the graphs refresh interval.
When the number of snapshots is reached the output is like:
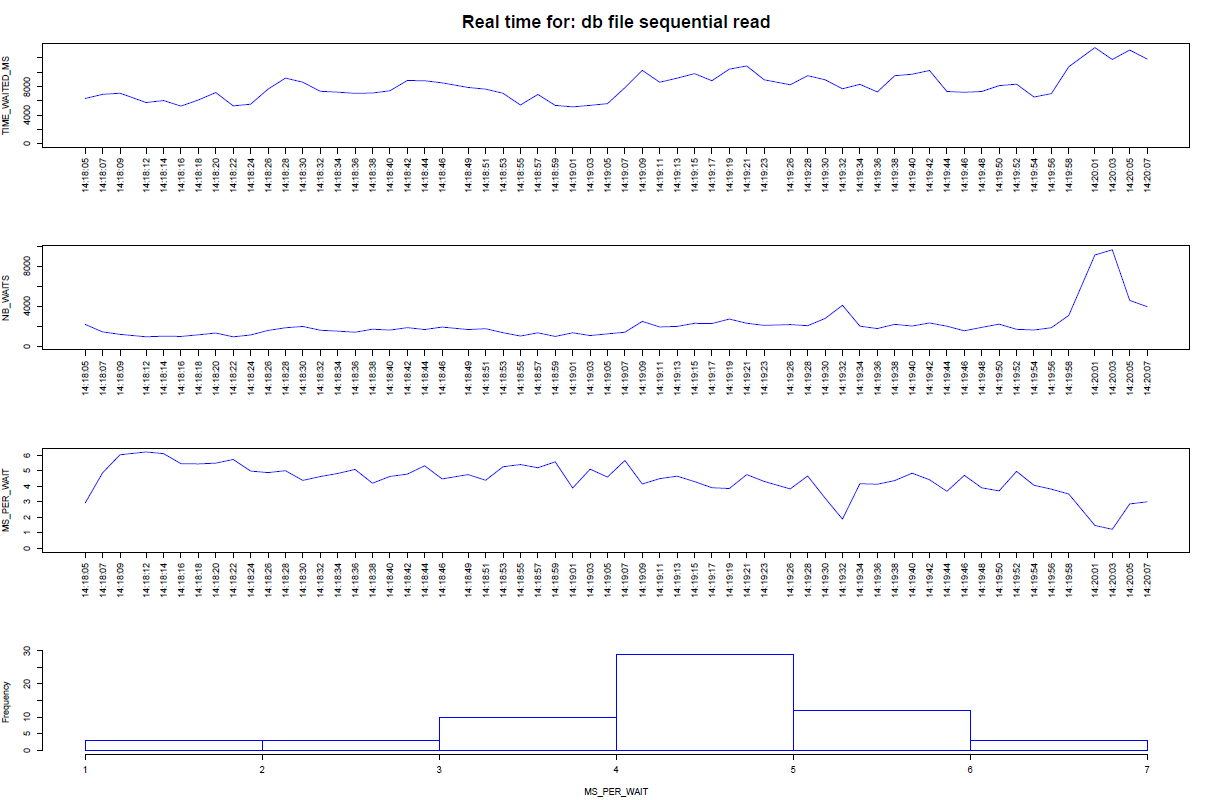
The graphs sequence that leads to this final graph is the following (see the real_time_db_file_sequential_read pdf file).
Remarks:
- All the points will be graphed (No points will be moved outside the graph), even if:
- For lisibility the X axis could contains not all the ticks.
- The script does not create any objects into the database.
- If you want to install R, a good staring point is into the “Getting Staring” section from this link.
- If you just want a text output in real time then see this blog post.
Conclusion:
We are now able to retrieve and display wait events metrics with R from AWR (see the previous post) and in real time.
Now that I am able to graph in real time with R, my next work is to graph in real time the metrics coming from my asmiostat utility. I’ll keep you posted.