When I need to deal with ASM I/O statistics, the tools provided by Oracle (asmcmd iostat and asmiostat.sh from MOS [ID 437996.1]) do not suit my needs.
Then, I decided to create my own asmiostat utility that is helpful for 3 main reasons:
- It provides useful real-time metrics.
- You can aggregate the results following your needs in a customizable way.
- It does not need any change to the source: Simply download it and use it.
The script takes a snapshot each second (default interval) from the gv$asm_disk_stat cumulative view (instead of gv$asm_disk because the information is exactly the same) and computes the differences with the previous snapshot.
The only difference with gv$asm_disk_stat is the information available in memory while v$asm_disk access the disks to re-collect some information. Since the information required doesn’t require to “re-collect” it from the disks, gv$asm_disk_stat is more appropriated here.
So, let’s have a look of the metrics collected by the script:
![]()
Description is the following:
- Reads/s: Number of read per second.
- KbyRead/s: Kbytes read per second.
- Avg ms/Read: ms per read in average.
- AvgBy/Read: Average Bytes per read.
- Read Errors: Number of Errors.
- Same metrics are provided for Write Operations.
The interesting part is that you can decide how those metrics have to be calculated/aggregated: I will give an example below and explain how to use the script to get this result.
Suppose I want to display the metrics by Diskgroup (default behavior), the output will be like:
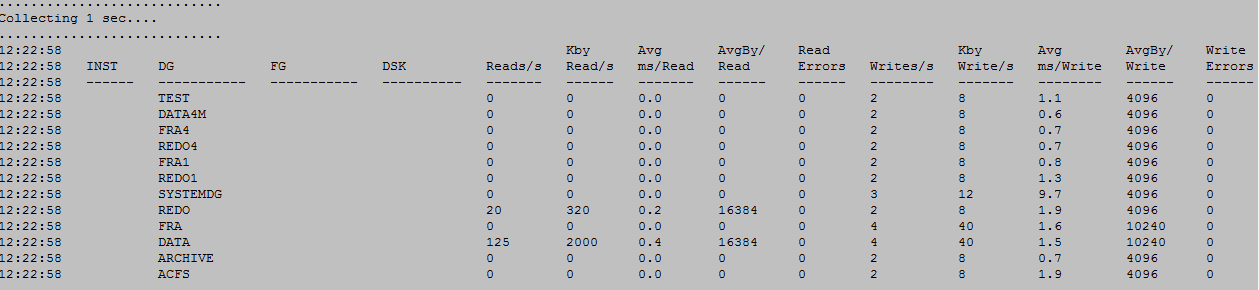
You see the blank values for: INST (instance), FG (Failgroup) and DSK (disks)? It means that those values have been aggregated.
Of course, you can display them as well, for example let’s display INST too:
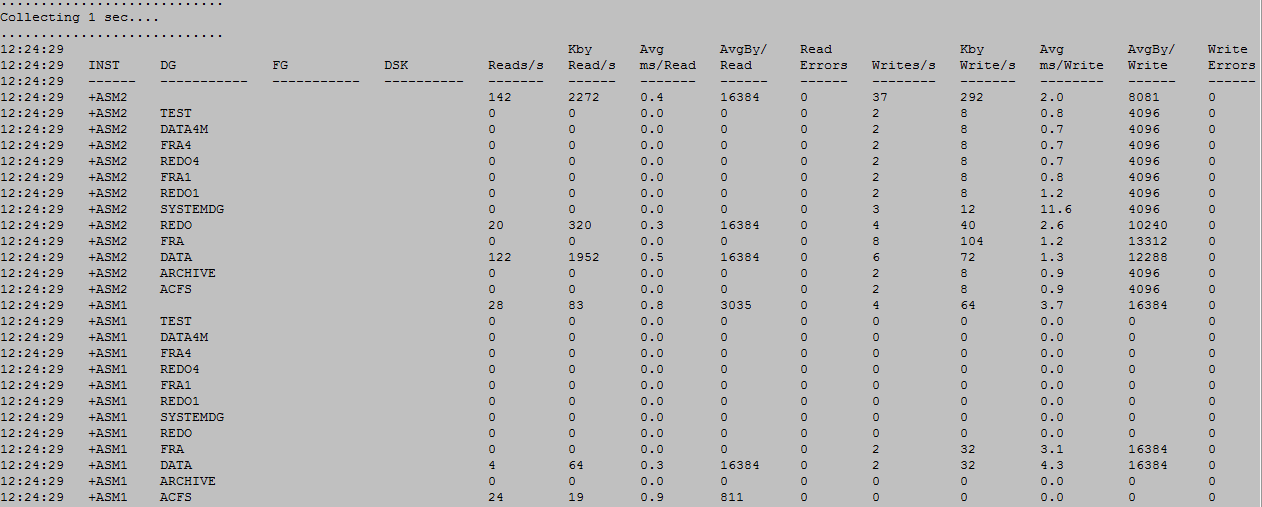
As you can see you now have the metrics for the diskgroups by Instance and also for the Instance itself (The row with the blank DG Field).
You can “play” with those fields (Inst, dg, fg, dsk) as you want. Display them (or not) to get their metrics using the <-show> argument of the script.
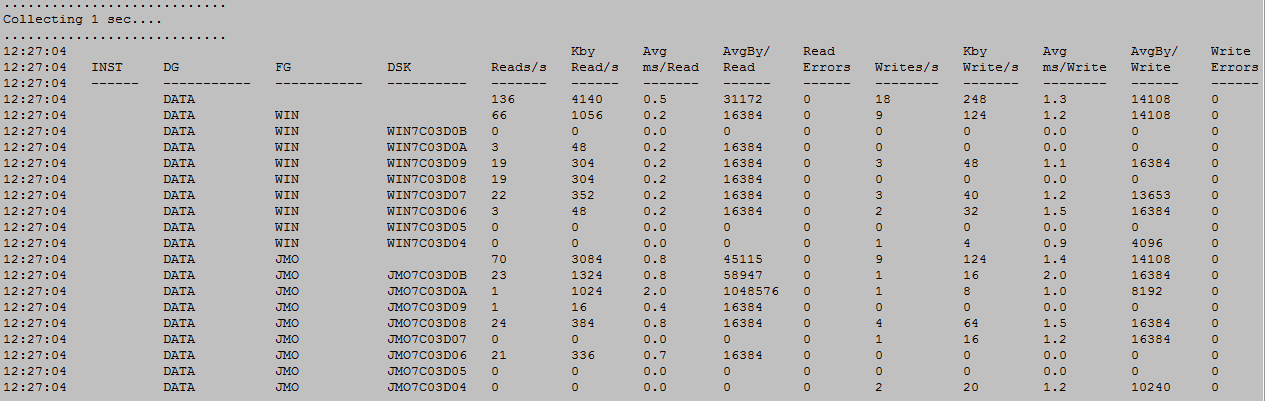
You can also filter on INST, DG and FG: For example let’s display the metrics for the DATA diskgroup and its associated disks and failgroups:
Now let’s see the utility usage:
The utility has been implemented as a part of the real_time.pl script (Click on the link, and then on the view source button and then copy/paste the source code. You can also download the script from this repository to avoid copy/paste (click on the link))
This script collects also a lot of useful real-time metrics: See description of this script into this post.
The help associated to amsiostat:
 ./real_time.pl -type=asmiostat -help

Usage: ./real_time.pl -type=asmiostat [-interval] [-count] [-inst] [-dg] [-fg] [-show] [-help]
 Default Interval : 1 second.
 Default Count    : Unlimited

  Parameter    Comment                                                      Default
  ---------    -------                                                      -------
  -INST=       ALL - Show all Instance(s)                                   ALL
               CURRENT - Show Current Instance
               INSTANCE_NAME,... - choose Instance(s) to display

  -DG=         Diskgroup to collect (comma separated list)                  ALL
  -FG=         Failgroup to collect (comma separated list)                  ALL
  -SHOW=       What to show: inst,fg,dg,dsk (comma separated list)          DG

Example: ./real_time.pl -type=asmiostat
Example: ./real_time.pl -type=asmiostat -inst=+ASM1
Example: ./real_time.pl -type=asmiostat -dg=DATA -show=dg
Example: ./real_time.pl -type=asmiostat -dg=data -show=inst,dg,fg
Example: ./real_time.pl -type=asmiostat -show=dg,dsk
Example: ./real_time.pl -type=asmiostat -show=inst,dg,fg,dsk
- You can choose the number of snapshots to display and the time to wait between snapshots.
- You can choose to filter on INST, DG and FG (by default no filter is applied).
- You can customize the output (means the fields on which the metrics are reported) following your need thanks to the <-show> argument.
- You have to set oraenv on one ASM instance.
- The script has been tested on Linux, Unix and Windows.
I hope this will be useful for you. If you have any suggestions, any metrics that you want to be integrated: Please do not hesitate to come back to me.
UPDATES:
- See how you can use this new utility to get ASM preferred read metrics in this post.
- ASM I/O Statistics Utility V2 is ready.
- The asmiostat utility is not part of the real_time.pl script anymore. A new utility called asm_metrics.pl has been created. See “ASM metrics are a gold mine. Welcome to asm_metrics.pl, a new utility to extract and to manipulate them in real time” for more information.